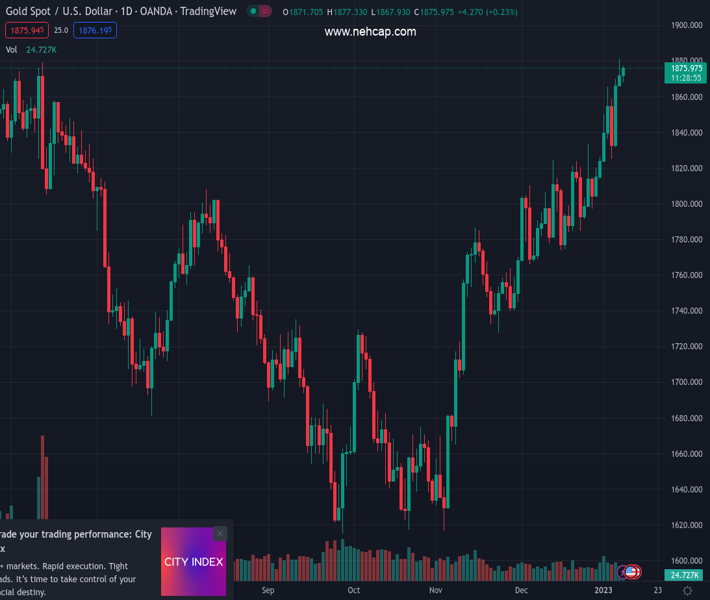
#XAUUSD @ 1,875.43 Gold price holds steady near an eight-month high touched on Monday, lacks follow-through. (Pivot Orderbook analysis)
…
This is a premium post.
[s2If !current_user_can(access_s2member_level4)]Please register for PREMIUM VERSION HERE to read full post below containing analysis. In case of any error or you think you are not able to read the full post below, please email us at support#nehcap.com [lwa][/s2If] [s2If current_user_can(access_s2member_level4)]
- Gold price holds steady near an eight-month high touched on Monday, lacks follow-through.
- Rebounding US Treasury bond yields revives the US Dollar demand and acts as a headwind.
- A softer risk tone lends some support as traders now keenly await Fed Chair Powell’s speech.
The pair currently trades last at 1875.43.
The previous day high was 1881.53 while the previous day low was 1865.22. The daily 38.2% Fib levels comes at 1875.3, expected to provide support. Similarly, the daily 61.8% fib level is at 1871.45, expected to provide support.
Gold price extends its consolidative price move for the second successive day on Tuesday and holds steady near an eight-month high touched the previous day. The XAU/USD is currently placed just below the $1,880 level as traders keenly await Federal Reserve (Fed) Chair Jerome Powell’s speech for a fresh impetus.
Powell is scheduled to speak at the Riksbank’s International Symposium on Central Bank Independence later during the early North American session. His remarks will be closely scrutinized for clues about the Fed’s rate-hike path. The focus, however, remains on the latest consumer inflation figures from the United States (US), due for release on Thursday. The crucial US CPI report will be looked upon for fresh insight into the Fed’s policy stance, which will play a key role in determining the near-term trajectory for the non-yielding Gold price.
Heading into the key event/data risk, the US Dollar (USD) stages a modest recovery from a seven-month low touched on Monday amid a goodish intraday pickup in the US Treasury bond yields. This, in turn, might cap any meaningful upside for the US Dollar-denominated Gold price. That said, the prospects for relatively smaller Fed rate hikes should act as a headwind for the US Treasury bond yields and the USD. In fact, the markets have been pricing in a 25 bps lift-off in February amid indications that inflationary pressures could be weakening.
Apart from this, the prevalent cautious mood could lend some support to the safe-haven Gold price and favours bullish traders. Despite China’s pivot away from its strict zero-COVID policy, worries that the massive flow of Chinese travellers may cause another surge in infections weigh on the risk sentiment. Furthermore, the protracted Russia-Ukraine war has been fueling concerns about a deeper global economic downturn and tempers investors’ appetite for riskier assets. This is evident from a softer tone around the equity markets and lends support to the XAU/USD.
The aforementioned fundamental backdrop suggests that the path of least resistance for the Gold price is to the upside and supports prospects for an extension of the recent appreciating move. That said, it will still be prudent to wait for a sustained move beyond the overnight swing high, around the $1,881 zone, before placing fresh bullish bets.
From a technical perspective, any corrective pullback now seems to find decent support near the $1,865-$1,860 resistance breakpoint. A sustained break below might prompt some technical selling around the Gold price, though could be bought into near the $1,835-$1,833 horizontal support. On the flip side, bulls are likely to aim to reclaim the $1,900 round figure for the first time since May 2022. Some follow-through buying will mark a fresh breakout and pave the way for additional near-term gains.
Technical Levels: Supports and Resistances
XAUUSD currently trading at 1875.03 at the time of writing. Pair opened at 1871.3 and is trading with a change of 0.2 % .
| Overview | Overview.1 | |
|---|---|---|
| 0 | Today last price | 1875.03 |
| 1 | Today Daily Change | 3.73 |
| 2 | Today Daily Change % | 0.20 |
| 3 | Today daily open | 1871.30 |
The pair remains strongly bullish on the daily timeframe. It trades above its 20 SMA @ 1816.84, 50 SMA 1773.44, 100 SMA @ 1728.3 and 200 SMA @ 1777.82.
| Trends | Trends.1 | |
|---|---|---|
| 0 | Daily SMA20 | 1816.84 |
| 1 | Daily SMA50 | 1773.44 |
| 2 | Daily SMA100 | 1728.30 |
| 3 | Daily SMA200 | 1777.82 |
The previous day high was 1881.53 while the previous day low was 1865.22. The daily 38.2% Fib levels comes at 1875.3, expected to provide support. Similarly, the daily 61.8% fib level is at 1871.45, expected to provide support.
Note the levels of interest below:
- Pivot support is noted at 1863.84, 1856.37, 1847.53
- Pivot resistance is noted at 1880.15, 1888.99, 1896.46
| Levels | Levels.1 |
|---|---|
| Previous Daily High | 1881.53 |
| Previous Daily Low | 1865.22 |
| Previous Weekly High | 1869.91 |
| Previous Weekly Low | 1823.76 |
| Previous Monthly High | 1833.38 |
| Previous Monthly Low | 1765.89 |
| Daily Fibonacci 38.2% | 1875.30 |
| Daily Fibonacci 61.8% | 1871.45 |
| Daily Pivot Point S1 | 1863.84 |
| Daily Pivot Point S2 | 1856.37 |
| Daily Pivot Point S3 | 1847.53 |
| Daily Pivot Point R1 | 1880.15 |
| Daily Pivot Point R2 | 1888.99 |
| Daily Pivot Point R3 | 1896.46 |
[/s2If]
Join Our Telegram Group
")


