#NZDUSD @ 0.63796 Investors are awaiting the speech from Fed Powell for fresh impetus. (Pivot Orderbook analysis)
…
This is a premium post.
[s2If !current_user_can(access_s2member_level4)]Please register for PREMIUM VERSION HERE to read full post below containing analysis. In case of any error or you think you are not able to read the full post below, please email us at support#nehcap.com [lwa][/s2If] [s2If current_user_can(access_s2member_level4)]
- Investors are awaiting the speech from Fed Powell for fresh impetus.
- A Double Bottom formation signifies a responsive buying action after a weak selling interest around the previous cushion.
- A bull cross, represented by the 20-and 50-period EMAs at 0.6300, adds to the upside filters.
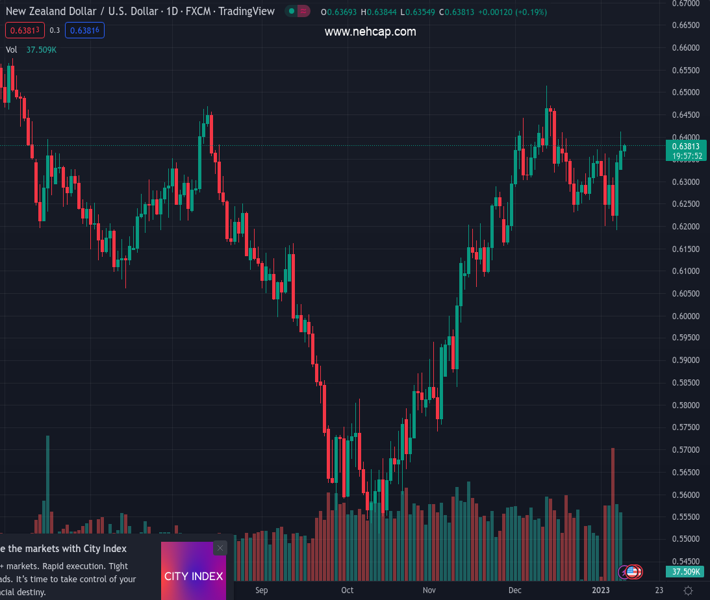
The pair currently trades last at 0.63796.
The previous day high was 0.6412 while the previous day low was 0.632. The daily 38.2% Fib levels comes at 0.6377, expected to provide support. Similarly, the daily 61.8% fib level is at 0.6355, expected to provide support.
The NZD/USD pair has corrected to near 0.6370 after sensing selling pressure near the round-level resistance of 0.6400 in the Asian session. The Kiwi asset is likely to remain on the tenterhooks as investors are awaiting the speech from Federal Reserve (Fed) chair Jerome Powell for fresh impetus.
Meanwhile, the risk impulse is quite confusing as S&P500 futures are recovering after dropping sharply in the early Asian session. Also, the alpha generated by 10-year Treasury yields has accelerated to near 3.55%.
A formation of a Double Bottom chart pattern around 0.6200 on a four-hour scale resulted in a firmer rally in NZD/USD. Usually, the chart pattern signifies a responsive buying action after a weak selling interest on previous support levels by the market participants.
A bull cross, represented by the 20-and 50-period Exponential Moving Averages (EMAs) at 0.6300, adds to the upside filters. Also, the 200-EMA at 0.6277 has acted as a cushion for the New Zealand Dollar.
The Relative Strength Index (RSI) (14) is trying hard to keep oscillation in the bullish range of 60.00-80.00 as it will maintain strength in the US Dollar.
After a firmer rally, it is highly likely that the Kiwi asset will test the critical support placed from January 4 high around 0.6350, which will trigger a bargain buy opportunity and will drive the major towards Monday’s high at 0.6412 followed by the psychological resistance at 0.6500.
On the contrary, a break below December 22 low at 0.6230 will expose the Kiwi asset for more downside toward November 28 low at 0.6155. A slippage below the latter will drag the asset further to near November 21 low at 0.6087.
Technical Levels: Supports and Resistances
NZDUSD currently trading at 0.6378 at the time of writing. Pair opened at 0.6372 and is trading with a change of 0.09 % .
| Overview | Overview.1 | |
|---|---|---|
| 0 | Today last price | 0.6378 |
| 1 | Today Daily Change | 0.0006 |
| 2 | Today Daily Change % | 0.0900 |
| 3 | Today daily open | 0.6372 |
The pair remains strongly bullish on the daily timeframe. It trades above its 20 SMA @ 0.6329, 50 SMA 0.6224, 100 SMA @ 0.6042 and 200 SMA @ 0.6222.
| Trends | Trends.1 | |
|---|---|---|
| 0 | Daily SMA20 | 0.6329 |
| 1 | Daily SMA50 | 0.6224 |
| 2 | Daily SMA100 | 0.6042 |
| 3 | Daily SMA200 | 0.6222 |
The previous day high was 0.6412 while the previous day low was 0.632. The daily 38.2% Fib levels comes at 0.6377, expected to provide support. Similarly, the daily 61.8% fib level is at 0.6355, expected to provide support.
Note the levels of interest below:
- Pivot support is noted at 0.6324, 0.6275, 0.6231
- Pivot resistance is noted at 0.6416, 0.646, 0.6509
| Levels | Levels.1 |
|---|---|
| Previous Daily High | 0.6412 |
| Previous Daily Low | 0.6320 |
| Previous Weekly High | 0.6363 |
| Previous Weekly Low | 0.6190 |
| Previous Monthly High | 0.6514 |
| Previous Monthly Low | 0.6230 |
| Daily Fibonacci 38.2% | 0.6377 |
| Daily Fibonacci 61.8% | 0.6355 |
| Daily Pivot Point S1 | 0.6324 |
| Daily Pivot Point S2 | 0.6275 |
| Daily Pivot Point S3 | 0.6231 |
| Daily Pivot Point R1 | 0.6416 |
| Daily Pivot Point R2 | 0.6460 |
| Daily Pivot Point R3 | 0.6509 |
[/s2If]
Join Our Telegram Group
")


