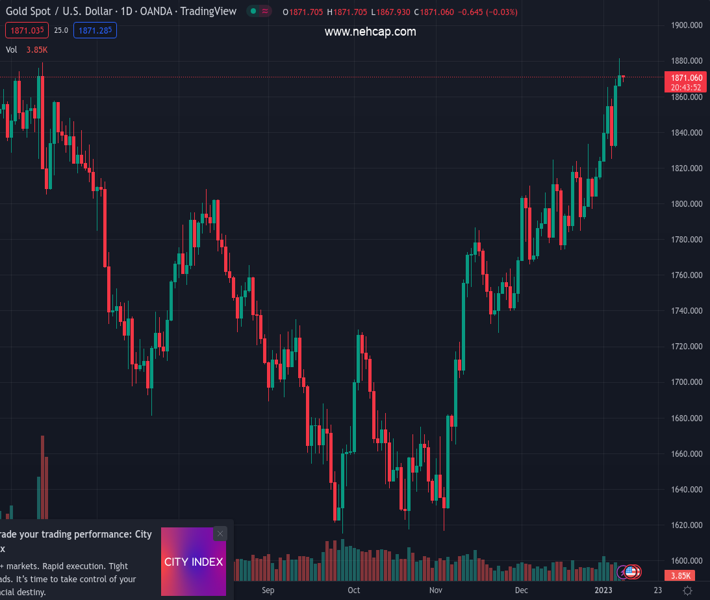
#XAUUSD @ 1,870.36 Gold price has slipped beneath $1,870.00, weighed down by a recovery in US Treasury yields. (Pivot Orderbook analysis)
…
This is a premium post.
[s2If !current_user_can(access_s2member_level4)]Please register for PREMIUM VERSION HERE to read full post below containing analysis. In case of any error or you think you are not able to read the full post below, please email us at support#nehcap.com [lwa][/s2If] [s2If current_user_can(access_s2member_level4)]
- Gold price has slipped beneath $1,870.00, weighed down by a recovery in US Treasury yields.
- A rangebound action is expected from the US Dollar Index (DXY) ahead of Fed Powell’s speech.
- Fed policymakers see the terminal rate at 5.00-5.25% to tame stubborn inflation.
The pair currently trades last at 1870.36.
The previous day high was 1881.53 while the previous day low was 1865.22. The daily 38.2% Fib levels comes at 1875.3, expected to provide resistance. Similarly, the daily 61.8% fib level is at 1871.45, expected to provide resistance.
Gold price (XAU/USD) has slipped below the immediate resistance of $1,870.00 in the Tokyo session. The precious metal has delivered a breakdown of the consolidation formed in a range of $1,870.00-1,881.50 as the demand for US government bonds is derailing ahead of the speech from Federal Reserve (Fed) chair Jerome Powell, which is scheduled for Tuesday.
The 10-year US Treasury yields have rebounded above 3.54%, weighing on risk-on impulse. Meanwhile, S&P500 futures have turned volatile after witnessing a sell-off in the late Monday session, portraying a caution in building positions in risk-sensitive assets. The US Dollar Index (DXY) is expected to attempt a break into the auction range above the immediate resistance of 103.00.
Investors are awaiting the speech from Fed Powell for fresh cues as it will provide a head-start for the entire CY2023. Well, other Fed policymakers are still favoring the terminal rate projection at 5.00-5.25% despite a significant drop in December wage inflation.
San Francisco Fed Bank President Mary Daly cited that it is reasonable for interest rates to be at 5%-5.25%. Also, Atlanta Federal Reserve bank president Raphael Bostic sees the interest rate peak in a 5%-5.25% range and the continuation of higher interest rates beyond CY2023.
Gold price is displaying signs of exhaustion as selling pressure is visible above $1,880.00. The precious metal has formed a Double Top chart pattern, which indicates a bearish reversal but needs more filters for activation. The yellow metal has slipped below the 20-period Exponential Moving Average (EMA) at $1,871.80, which indicates a correction in the north-side trend.
Also, the Relative Strength Index (RSI) (14) has shifted into the 40.00-60.00 range from the bullish range of 60.00-80.00, which indicates that the bullish momentum has faded.
Technical Levels: Supports and Resistances
XAUUSD currently trading at 1870.76 at the time of writing. Pair opened at 1871.3 and is trading with a change of -0.03 % .
| Overview | Overview.1 | |
|---|---|---|
| 0 | Today last price | 1870.76 |
| 1 | Today Daily Change | -0.54 |
| 2 | Today Daily Change % | -0.03 |
| 3 | Today daily open | 1871.30 |
The pair remains strongly bullish on the daily timeframe. It trades above its 20 SMA @ 1816.84, 50 SMA 1773.44, 100 SMA @ 1728.3 and 200 SMA @ 1777.82.
| Trends | Trends.1 | |
|---|---|---|
| 0 | Daily SMA20 | 1816.84 |
| 1 | Daily SMA50 | 1773.44 |
| 2 | Daily SMA100 | 1728.30 |
| 3 | Daily SMA200 | 1777.82 |
The previous day high was 1881.53 while the previous day low was 1865.22. The daily 38.2% Fib levels comes at 1875.3, expected to provide resistance. Similarly, the daily 61.8% fib level is at 1871.45, expected to provide resistance.
Note the levels of interest below:
- Pivot support is noted at 1863.84, 1856.37, 1847.53
- Pivot resistance is noted at 1880.15, 1888.99, 1896.46
| Levels | Levels.1 |
|---|---|
| Previous Daily High | 1881.53 |
| Previous Daily Low | 1865.22 |
| Previous Weekly High | 1869.91 |
| Previous Weekly Low | 1823.76 |
| Previous Monthly High | 1833.38 |
| Previous Monthly Low | 1765.89 |
| Daily Fibonacci 38.2% | 1875.30 |
| Daily Fibonacci 61.8% | 1871.45 |
| Daily Pivot Point S1 | 1863.84 |
| Daily Pivot Point S2 | 1856.37 |
| Daily Pivot Point S3 | 1847.53 |
| Daily Pivot Point R1 | 1880.15 |
| Daily Pivot Point R2 | 1888.99 |
| Daily Pivot Point R3 | 1896.46 |
[/s2If]
Join Our Telegram Group
")


