#USDJPY @ 131.718 extends two-day downtrend even after mixed Tokyo inflation figures. (Pivot Orderbook analysis)
…
This is a premium post.
[s2If !current_user_can(access_s2member_level4)]Please register for PREMIUM VERSION HERE to read full post below containing analysis. In case of any error or you think you are not able to read the full post below, please email us at support#nehcap.com [lwa][/s2If] [s2If current_user_can(access_s2member_level4)]
- USD/JPY extends two-day downtrend even after mixed Tokyo inflation figures.
- Tokyo Consumer Price Index eased below market forecasts, CPI ex Food, Energy matched upbeat expectations.
- Downbeat yields, hawkish hopes from BOJ challenge recovery moves.
- Upbeat Fedspeak, long weekend in Japan allowed Yen bears to take a breather ahead of Fed Chair Powell’s speech.
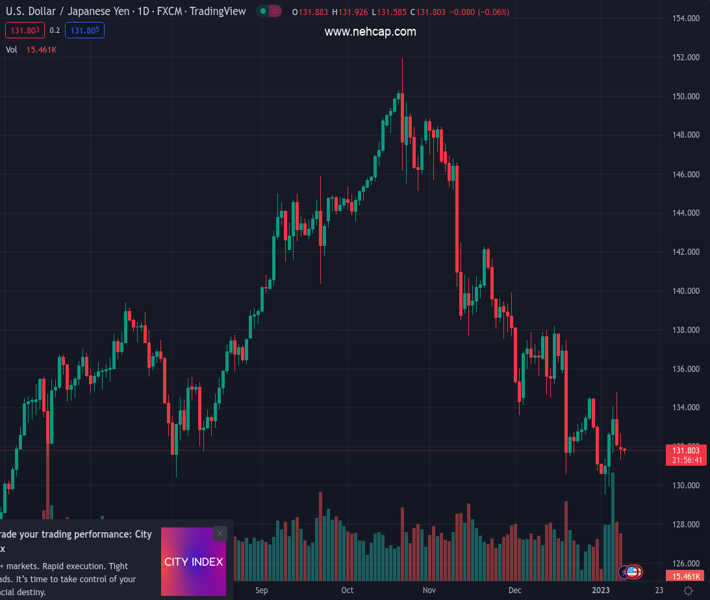
The pair currently trades last at 131.718.
The previous day high was 134.78 while the previous day low was 131.99. The daily 38.2% Fib levels comes at 133.06, expected to provide resistance. Similarly, the daily 61.8% fib level is at 133.71, expected to provide resistance.
USD/JPY takes offers to refresh the intraday low near 131.60 as it prints a three-day downtrend even as the Tokyo inflation data fails to bolster hawkish expectations from the Bank of Japan (BOJ). The reason could be linked to the long weekend in Japan, as well as the wait for Fed Chair Jerome Powell’s speech and the US inflation data.
As per the latest Tokyo inflation data, the headline Consumer Price Index (CPI) rose by 4.0% versus 4.5% market forecasts and 3.8% previous readings. Further, the Tokyo CPI ex-Food, Energy matched 2.7% YoY forecasts versus 2.5% prior.
However, hawkish Fedspeak and waiting for full markets, as well as a speech from Fed Chair Jerome Powell, seemed to have put a floor under the Yen prices.
Given the escalating price pressure in Japan, the odds of the Bank of Japan’s (BOJ) exit from the easy money policy gains momentum and weighs on the USD/JPY. That said, Japanese Prime Minister Fumio Kishida said on Sunday his government and the central bank must discuss their relationship in guiding economic policy after he names a new Bank of Japan (BOJ) governor in April, reported Reuters. The recent chatters over the BOJ’s readiness to edit the Yield Curve Control (YCC) policy seemed to have weighed on the USD/JPY prices of late.
It’s worth noting that the hawkish comments from the Fed policymakers join the firmer prints of the US inflation expectations to challenge the USD/JPY bears.
On Monday, Atlanta Federal Reserve bank president Raphael Bostic said that it is ”fair to say that the Fed is willing to overshoot.” On the same line, San Francisco Federal Reserve Bank President Mary Daly stated that they are determined, united, resolute to bring inflation down. Additionally, the Federal Reserve Bank of New York’s monthly Survey of Consumer Expectations showed on Monday that the US consumers’ one-year inflation expectation declined to 5% in December from 5.2% prior. Alternatively, the three-year ahead expected inflation remained unchanged at 3% and the five-year ahead expected inflation edged higher to 2.4% from 2.3%.
Against this backdrop, the US 10-year Treasury yields dropped five basis points to 3.51% while printing the three-day downtrend whereas Wall Street closed mixed.
Looking forward, USD/JPY traders will pay attention to Fed Chairman Jerome Powell’s speech, as well as Thursday’s US inflation data, for near-term directions amid receding hawkish bias for the Fed.
A daily closing beyond the 21-DMA hurdle surrounding 133.35 becomes necessary for the USD/JPY buyers to retake control, even for the short-term.
Technical Levels: Supports and Resistances
USDJPY currently trading at 131.78 at the time of writing. Pair opened at 132.1 and is trading with a change of -0.24% % .
| Overview | Overview.1 | |
|---|---|---|
| 0 | Today last price | 131.78 |
| 1 | Today Daily Change | -0.32 |
| 2 | Today Daily Change % | -0.24% |
| 3 | Today daily open | 132.1 |
The pair remains strongly bearish on the daily time frame. It trades below the 20 SMA @ 133.72, 50 SMA 138.02, 100 SMA @ 140.95 and 200 SMA @ 136.46.
| Trends | Trends.1 | |
|---|---|---|
| 0 | Daily SMA20 | 133.72 |
| 1 | Daily SMA50 | 138.02 |
| 2 | Daily SMA100 | 140.95 |
| 3 | Daily SMA200 | 136.46 |
The previous day high was 134.78 while the previous day low was 131.99. The daily 38.2% Fib levels comes at 133.06, expected to provide resistance. Similarly, the daily 61.8% fib level is at 133.71, expected to provide resistance.
Note the levels of interest below:
- Pivot support is noted at 131.14, 130.17, 128.35
- Pivot resistance is noted at 133.92, 135.74, 136.7
| Levels | Levels.1 |
|---|---|
| Previous Daily High | 134.78 |
| Previous Daily Low | 131.99 |
| Previous Weekly High | 134.78 |
| Previous Weekly Low | 129.51 |
| Previous Monthly High | 138.18 |
| Previous Monthly Low | 130.57 |
| Daily Fibonacci 38.2% | 133.06 |
| Daily Fibonacci 61.8% | 133.71 |
| Daily Pivot Point S1 | 131.14 |
| Daily Pivot Point S2 | 130.17 |
| Daily Pivot Point S3 | 128.35 |
| Daily Pivot Point R1 | 133.92 |
| Daily Pivot Point R2 | 135.74 |
| Daily Pivot Point R3 | 136.70 |
[/s2If]
Join Our Telegram Group
")


