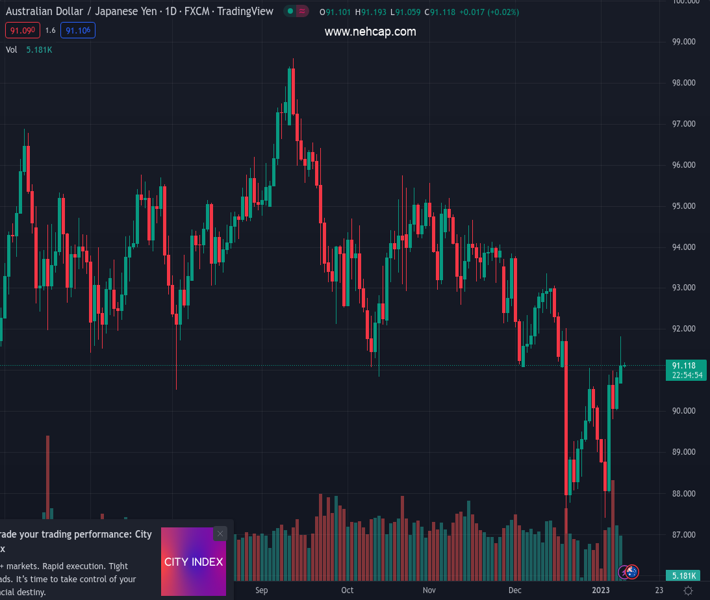
#AUDJPY @ 91.1220 tested but failed to clear solid resistance around the 100 and 200-day EMAs. (Pivot Orderbook analysis)
…
This is a premium post.
[s2If !current_user_can(access_s2member_level4)]Please register for PREMIUM VERSION HERE to read full post below containing analysis. In case of any error or you think you are not able to read the full post below, please email us at support#nehcap.com [lwa][/s2If] [s2If current_user_can(access_s2member_level4)]
- AUD/JPY tested but failed to clear solid resistance around the 100 and 200-day EMAs.
- AUD/JPY Price Analysis: A break above 91.70 could open the door for additional gains.
The pair currently trades last at 91.1220.
The previous day high was 90.95 while the previous day low was 90.0. The daily 38.2% Fib levels comes at 90.59, expected to provide support. Similarly, the daily 61.8% fib level is at 90.37, expected to provide support.
The AUD/JPY edged up during Monday’s session, though it faltered to clear the 200-day Exponential Moving Average (EMA) around 91.66, retracing from the daily highs, and aimed toward January 4 highs around 90.88. As Tuesday’s Asian Pacific session begins, the AUD/JPY is trading with minuscule gains of 0.01%, at around 91.11.
AUD/JPY Monday’s price action witnessed the formation of an inverted hammer preceded by a slight uptrend after the AUD/JPY bottomed at around 87.40s, forming a double bottom. Albeit AUD sellers pushed exchange rates toward’s 91.05, they failed to achieve a daily close beneath that price level, which would have opened the door for further losses and invalidated the chart pattern.
However, the AUD/JPY might consolidate in the near term and depend on market sentiment and Aussie (AUD) upbeat news. So if the AUD/JPY is to resume its uptrend, it would need to decisively reclaim the 100 and 200-day EMAs at around 91.57 and 91.66, respectively, which, once cleared, could open the door for further gains.
If that scenario plays out, the AUD/JPY first resistance would be 92.00. A breach of the latter will send the cross rallying toward December’s 13 daily high of 93.35, followed by the 94.00 figure and the 95.00 mark.
Technical Levels: Supports and Resistances
AUDJPY currently trading at 91.17 at the time of writing. Pair opened at 90.94 and is trading with a change of 0.25 % .
| Overview | Overview.1 | |
|---|---|---|
| 0 | Today last price | 91.17 |
| 1 | Today Daily Change | 0.23 |
| 2 | Today Daily Change % | 0.25 |
| 3 | Today daily open | 90.94 |
The pair is trading above its 20 Daily moving average @ 90.32, below its 50 Daily moving average @ 92.2 , below its 100 Daily moving average @ 93.43 and below its 200 Daily moving average @ 93.25
| Trends | Trends.1 | |
|---|---|---|
| 0 | Daily SMA20 | 90.32 |
| 1 | Daily SMA50 | 92.20 |
| 2 | Daily SMA100 | 93.43 |
| 3 | Daily SMA200 | 93.25 |
The previous day high was 90.95 while the previous day low was 90.0. The daily 38.2% Fib levels comes at 90.59, expected to provide support. Similarly, the daily 61.8% fib level is at 90.37, expected to provide support.
Note the levels of interest below:
- Pivot support is noted at 90.31, 89.68, 89.36
- Pivot resistance is noted at 91.26, 91.58, 92.21
| Levels | Levels.1 |
|---|---|
| Previous Daily High | 90.95 |
| Previous Daily Low | 90.00 |
| Previous Weekly High | 90.99 |
| Previous Weekly Low | 87.41 |
| Previous Monthly High | 93.81 |
| Previous Monthly Low | 87.02 |
| Daily Fibonacci 38.2% | 90.59 |
| Daily Fibonacci 61.8% | 90.37 |
| Daily Pivot Point S1 | 90.31 |
| Daily Pivot Point S2 | 89.68 |
| Daily Pivot Point S3 | 89.36 |
| Daily Pivot Point R1 | 91.26 |
| Daily Pivot Point R2 | 91.58 |
| Daily Pivot Point R3 | 92.21 |
[/s2If]
Join Our Telegram Group
")


