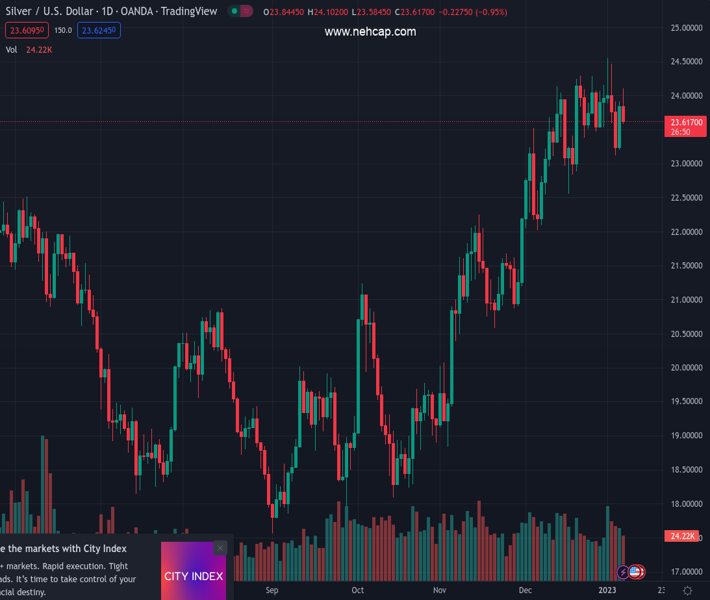
#XAGUSD @ 23.615 Silver price failed to gain traction, even though the US Dollar and US Treasury bond yields dropped. (Pivot Orderbook analysis)
…
This is a premium post.
[s2If !current_user_can(access_s2member_level4)]Please register for PREMIUM VERSION HERE to read full post below containing analysis. In case of any error or you think you are not able to read the full post below, please email us at support#nehcap.com [lwa][/s2If] [s2If current_user_can(access_s2member_level4)]
- Silver price failed to gain traction, even though the US Dollar and US Treasury bond yields dropped.
- Latest US jobs data flashing that wages are aiming lower keeps traders hopeful for a Fed pivot.
- Silver Price Analysis: Bears mounted around $24.00, dragging prices towards the 20-DMA.
The pair currently trades last at 23.615.
The previous day high was 23.91 while the previous day low was 23.2. The daily 38.2% Fib levels comes at 23.64, expected to provide resistance. Similarly, the daily 61.8% fib level is at 23.47, expected to provide support.
Silver price stumbles as Wall Street entered its last hour of trading on Monday after hitting a daily high of $24.09 but retraced those gains, albeit market sentiment remains positive as shown by US equities trading with solid gains. Therefore, the US Dollar (USD) weakened, bolstering dollar-denominated commodities. At the time of writing, XAG/USD is trading at $23.64, below its opening price by 0.64%.
Optimism surrounds worldwide investors as most global equity indices edged higher. China’s reopening and last week’s mixed economic data from the United States (US) were some of the reasons that weighed on the greenback, alongside growing speculations that the US Federal Reserve (Fed) might pivot.
Last week’s employment data showed the US labor market resilient, adding more jobs than estimated. Still, the data spotlight was Average Hourly Earnings, which dropped to 4.6% YoY, below the previous month’s 5%. That eased some of the Federal Reserve’s (Fed) pressures to curb inflation and even opened the door for a 25 bp rate increase for February 1, as shown by the swaps market.
Therefore, traders are repricing a less hawkish Fed, as shown by the US bond market. The US 10-year Treasury bond rate yields 3.53%, losing three and a half bps, undermining the greenback. The US Dollar Index, which measures the buck’s value against a basket of six currencies, edges lower by 0.71%, down at 103.171.
From a daily chart perspective, XAG/USD remains upward biased, with prices trending above the 20 and 50-day Exponential Moving Averages (EMAs), which remain as a support level. Last Friday’s price action formed a bullish engulfing candle pattern, which is usually a bullish pattern. However, XAG/USD failure to hold to its gains above Friday’s $23.90 daily high, and oscillators aimed lower capped silver rally.
Therefore, the XAG/USD first support would be the 20- day EMA at 23.48. Break below will expose the last week’s low of $23.12, followed by the $23.00 figure.
Technical Levels: Supports and Resistances
XAGUSD currently trading at 23.62 at the time of writing. Pair opened at 23.84 and is trading with a change of -0.92 % .
| Overview | Overview.1 | |
|---|---|---|
| 0 | Today last price | 23.62 |
| 1 | Today Daily Change | -0.22 |
| 2 | Today Daily Change % | -0.92 |
| 3 | Today daily open | 23.84 |
The pair is trading below its 20 Daily moving average @ 23.68, above its 50 Daily moving average @ 22.31 , above its 100 Daily moving average @ 20.71 and above its 200 Daily moving average @ 21.1
| Trends | Trends.1 | |
|---|---|---|
| 0 | Daily SMA20 | 23.68 |
| 1 | Daily SMA50 | 22.31 |
| 2 | Daily SMA100 | 20.71 |
| 3 | Daily SMA200 | 21.10 |
The previous day high was 23.91 while the previous day low was 23.2. The daily 38.2% Fib levels comes at 23.64, expected to provide resistance. Similarly, the daily 61.8% fib level is at 23.47, expected to provide support.
Note the levels of interest below:
- Pivot support is noted at 23.39, 22.94, 22.68
- Pivot resistance is noted at 24.1, 24.36, 24.81
| Levels | Levels.1 |
|---|---|
| Previous Daily High | 23.91 |
| Previous Daily Low | 23.20 |
| Previous Weekly High | 24.55 |
| Previous Weekly Low | 23.12 |
| Previous Monthly High | 24.30 |
| Previous Monthly Low | 22.03 |
| Daily Fibonacci 38.2% | 23.64 |
| Daily Fibonacci 61.8% | 23.47 |
| Daily Pivot Point S1 | 23.39 |
| Daily Pivot Point S2 | 22.94 |
| Daily Pivot Point S3 | 22.68 |
| Daily Pivot Point R1 | 24.10 |
| Daily Pivot Point R2 | 24.36 |
| Daily Pivot Point R3 | 24.81 |
[/s2If]
Join Our Telegram Group
")


