#EURUSD @ 1.06884 picks up bids to refresh intraday high, approaches three-week-old resistance line., @nehcap view: Further upside expected (Pivot Orderbook analysis)
…
This is a premium post.
[s2If !current_user_can(access_s2member_level4)]Please register for PREMIUM VERSION HERE to read full post below containing analysis. In case of any error or you think you are not able to read the full post below, please email us at support#nehcap.com [lwa][/s2If] [s2If current_user_can(access_s2member_level4)]
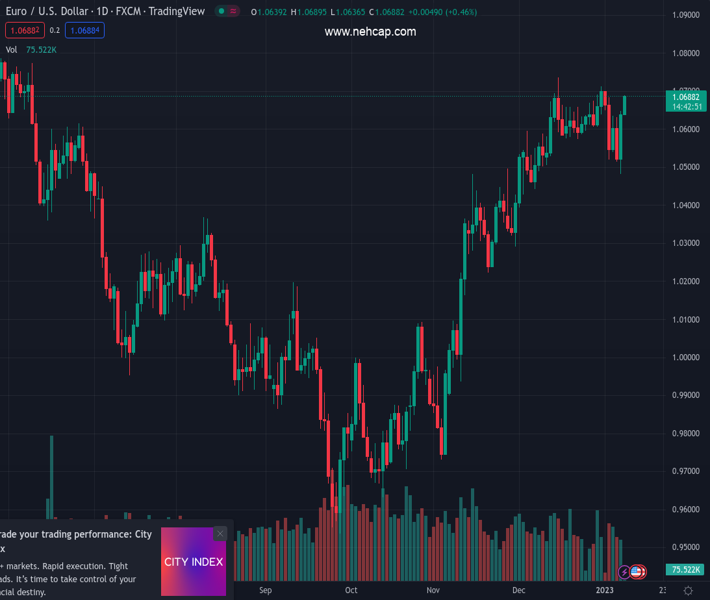
- EUR/USD picks up bids to refresh intraday high, approaches three-week-old resistance line.
- Receding bearish bias of MACD, sustained rebound from 50% Fibonacci retracement level strengthen upside hopes.
- Two-month-old ascending trend line, 50-DMA restrict short-term downside.
- Golden ratio, May 2022 peak act as additional upside filters inside megaphone trend-widening pattern.
The pair currently trades last at 1.06884.
The previous day high was 1.0648 while the previous day low was 1.0483. The daily 38.2% Fib levels comes at 1.0585, expected to provide support. Similarly, the daily 61.8% fib level is at 1.0546, expected to provide support.
EUR/USD holds onto the US NFP-led bullish bias as it marches towards 1.0700 during early Monday, up 0.30% intraday near 1.0680 by the press time.
In doing so, the major currency pair extends the previous day’s U-turn from a 50% Fibonacci retracement level of the February-September 2022 downside to approach a one-month-old resistance line, close to the 1.0700 by the press time.
It’s worth noting that the EUR/USD pair’s successful trading above the 50-DMA and the recently easing bearish bias of the MACD also favor the bulls.
However, the 61.8% Fibonacci retracement level surrounding 1.0745, also known as the “Golden Ratio”, precedes the May 2022 peak of 1.0786 to challenge the EUR/USD bulls.
Following that, the 1.0800 round figure could act as the last defense of the EUR/USD bears before directing the quote towards the late April 2022 high near 1.0935.
On the flip side, an upward-sloping trend line from early November 2022, close to 1.0560 at the latest, restricts short-term EUR/USD pullback.
However, the pair sellers will need a successful break of the 50% Fibonacci retracement level and the 50-DMA, close to 1.0510 and 1.0425 in that order, to retake control.
Trend: Further upside expected
Technical Levels: Supports and Resistances
EURUSD currently trading at 1.0682 at the time of writing. Pair opened at 1.0646 and is trading with a change of 0.34% % .
| Overview | Overview.1 | |
|---|---|---|
| 0 | Today last price | 1.0682 |
| 1 | Today Daily Change | 0.0036 |
| 2 | Today Daily Change % | 0.34% |
| 3 | Today daily open | 1.0646 |
The pair remains strongly bullish on the daily timeframe. It trades above its 20 SMA @ 1.0616, 50 SMA 1.041, 100 SMA @ 1.015 and 200 SMA @ 1.0314.
| Trends | Trends.1 | |
|---|---|---|
| 0 | Daily SMA20 | 1.0616 |
| 1 | Daily SMA50 | 1.0410 |
| 2 | Daily SMA100 | 1.0150 |
| 3 | Daily SMA200 | 1.0314 |
The previous day high was 1.0648 while the previous day low was 1.0483. The daily 38.2% Fib levels comes at 1.0585, expected to provide support. Similarly, the daily 61.8% fib level is at 1.0546, expected to provide support.
Note the levels of interest below:
- Pivot support is noted at 1.0537, 1.0427, 1.0372
- Pivot resistance is noted at 1.0702, 1.0757, 1.0867
| Levels | Levels.1 |
|---|---|
| Previous Daily High | 1.0648 |
| Previous Daily Low | 1.0483 |
| Previous Weekly High | 1.0710 |
| Previous Weekly Low | 1.0483 |
| Previous Monthly High | 1.0736 |
| Previous Monthly Low | 1.0393 |
| Daily Fibonacci 38.2% | 1.0585 |
| Daily Fibonacci 61.8% | 1.0546 |
| Daily Pivot Point S1 | 1.0537 |
| Daily Pivot Point S2 | 1.0427 |
| Daily Pivot Point S3 | 1.0372 |
| Daily Pivot Point R1 | 1.0702 |
| Daily Pivot Point R2 | 1.0757 |
| Daily Pivot Point R3 | 1.0867 |
[/s2If]
Join Our Telegram Group


