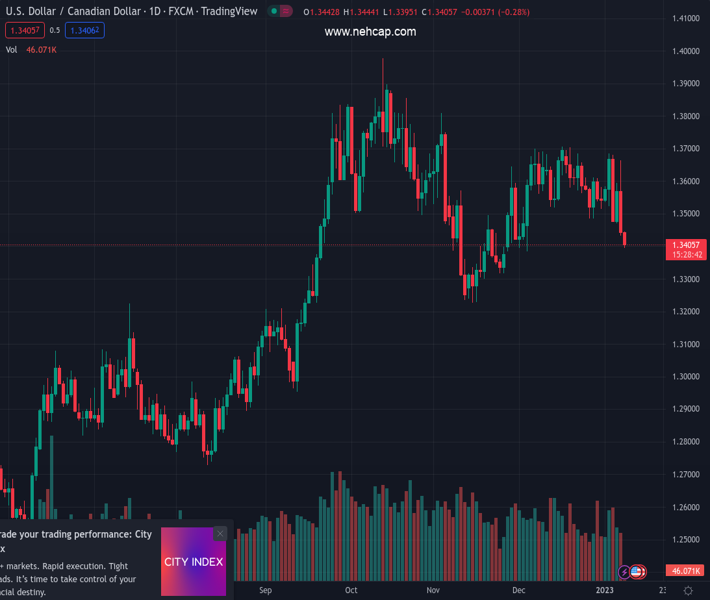
#USDCAD @ 1.34049 drops to the lowest levels in one month as bears keep the reins. (Pivot Orderbook analysis)
…
This is a premium post.
[s2If !current_user_can(access_s2member_level4)]Please register for PREMIUM VERSION HERE to read full post below containing analysis. In case of any error or you think you are not able to read the full post below, please email us at support#nehcap.com [lwa][/s2If] [s2If current_user_can(access_s2member_level4)]
- USD/CAD drops to the lowest levels in one month as bears keep the reins.
- China reopening, challenges for Fed hawks underpin risk-on mood.
- Oil price grinds higher amid softer US Dollar, hopes of more energy demand from China.
- Upbeat Canada jobs report versus mixed US data adds strength to the bearish moves.
The pair currently trades last at 1.34049.
The previous day high was 1.3664 while the previous day low was 1.3433. The daily 38.2% Fib levels comes at 1.3522, expected to provide resistance. Similarly, the daily 61.8% fib level is at 1.3576, expected to provide resistance.
USD/CAD bears occupy the driver’s seat as the Loonie pair slides to the lowest levels in a month heading into Monday’s European session. In doing so, the quote takes clues from the market’s upbeat sentiment, as well as firmer prices of Canada’s main export item WTI crude oil.
That said, WTI crude oil buyers poke $75.00 amid expectations that the China-inspired global optimism could tame the recession fears and inflate the energy demand. Also likely to have favored the black gold prices could be the downbeat US Dollar and geopolitical fears surrounding Russia.
Elsewhere, China’s reopening of the international borders after a three-year blockage bolstered the market’s optimism. Also favoring the risk appetite could be comments from the People’s Bank of China (PBOC) Official who hinted at robust growth expectations from the dragon nation.
Additionally favoring the USD/CAD bears could be the challenge for the Federal Reserve (Fed) hawks, especially after the latest US data. On Friday, United States Nonfarm Payrolls (NFP) rose by 223,000 in December compared to the market expectations of 200,000 and November’s increase of 256,000 (revised from 263,000). Further details of the US December jobs report revealed that the Unemployment Rate declined to 3.5% from 3.6% in November and 3.7% expected. More importantly, the Average hourly earnings rose 0.3% in December versus 0.4% prior while the YoY figures eased to 4.6% from 4.8% in November.
Further, US ISM Services PMI slumped to the lowest levels in 31 months while suggesting a contraction in activities with 49.6 figures for December, versus the market expectations of 55 and 56.5 marked in November. On the same line, US Factory Orders also slumped, falling 1.8% in November after gaining 0.4% in October.
On the other hand, Canada’s Net Change in Employment rose by 104K in December versus 8K expected and 10.1K prior while the Unemployment Rate dropped to 5.0% during the stated month, compared to 5.2% market forecasts and 5.1% previous readings.
Despite the mixed readings of the key US data, Atlanta Federal Reserve bank president Raphael Bostic stated that the US economy is definitely slowing, which in turn drowned the key US Treasury bond yields and the US Dollar. That said, the US 10-year Treasury yields dropped 16 basis points (bps) to 3.56%, the lowest levels in three weeks, whereas the US Dollar Index (DXY) marked the biggest daily slump since November 11.
Against this backdrop, Wall Street closed with notable gains and helps the S&P 500 futures to remain firmer, which in turn exerts downside pressure on the US Dollar and favors Oil prices.
Moving on, Thursday’s US inflation data will be crucial for the USD/CAD pair traders while today’s Canadian Building Permits and Tuesday’s speech from Bank of Canada (BOC) Governor Tiff Macklem could offer intermediate directions.
A clear downside break of the 100-DMA, around 1.3480 by the press time, directs the USD/CAD bears towards the 1.3230-25 support zone comprising a seven-month-old ascending trend line and multiple levels marked since July 2022.
Technical Levels: Supports and Resistances
USDCAD currently trading at 1.3404 at the time of writing. Pair opened at 1.3444 and is trading with a change of -0.30% % .
| Overview | Overview.1 | |
|---|---|---|
| 0 | Today last price | 1.3404 |
| 1 | Today Daily Change | -0.0040 |
| 2 | Today Daily Change % | -0.30% |
| 3 | Today daily open | 1.3444 |
The pair is trading below its 20 Daily moving average @ 1.3588, below its 50 Daily moving average @ 1.3522 , below its 100 Daily moving average @ 1.3476 and above its 200 Daily moving average @ 1.3148
| Trends | Trends.1 | |
|---|---|---|
| 0 | Daily SMA20 | 1.3588 |
| 1 | Daily SMA50 | 1.3522 |
| 2 | Daily SMA100 | 1.3476 |
| 3 | Daily SMA200 | 1.3148 |
The previous day high was 1.3664 while the previous day low was 1.3433. The daily 38.2% Fib levels comes at 1.3522, expected to provide resistance. Similarly, the daily 61.8% fib level is at 1.3576, expected to provide resistance.
Note the levels of interest below:
- Pivot support is noted at 1.3364, 1.3283, 1.3132
- Pivot resistance is noted at 1.3595, 1.3745, 1.3826
| Levels | Levels.1 |
|---|---|
| Previous Daily High | 1.3664 |
| Previous Daily Low | 1.3433 |
| Previous Weekly High | 1.3685 |
| Previous Weekly Low | 1.3433 |
| Previous Monthly High | 1.3705 |
| Previous Monthly Low | 1.3385 |
| Daily Fibonacci 38.2% | 1.3522 |
| Daily Fibonacci 61.8% | 1.3576 |
| Daily Pivot Point S1 | 1.3364 |
| Daily Pivot Point S2 | 1.3283 |
| Daily Pivot Point S3 | 1.3132 |
| Daily Pivot Point R1 | 1.3595 |
| Daily Pivot Point R2 | 1.3745 |
| Daily Pivot Point R3 | 1.3826 |
[/s2If]
Join Our Telegram Group


