#USDCNH @ 6.78522 drops to the lowest levels since August 17, 2022., @nehcap view: Further downside expected (Pivot Orderbook analysis)
…
This is a premium post.
[s2If !current_user_can(access_s2member_level4)]Please register for PREMIUM VERSION HERE to read full post below containing analysis. In case of any error or you think you are not able to read the full post below, please email us at support#nehcap.com [lwa][/s2If] [s2If current_user_can(access_s2member_level4)]
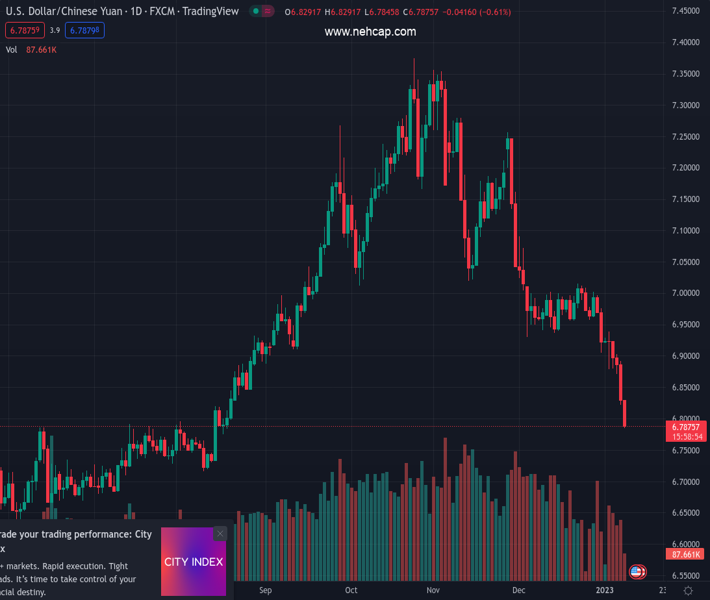
- USD/CNH drops to the lowest levels since August 17, 2022.
- Clear break of 200-DMA, bearish MACD signals favor sellers as they eye two-month-old descending support line.
- Previous support line from June adds to the upside filters.
The pair currently trades last at 6.78522.
The previous day high was 6.8932 while the previous day low was 6.8236. The daily 38.2% Fib levels comes at 6.8502, expected to provide resistance. Similarly, the daily 61.8% fib level is at 6.8667, expected to provide resistance.
USD/CNH takes offers to renew a multi-day low around 6.7900 heading into Monday’s European session. In doing so, the offshore Chinese Yuan (CNH) pair extends the previous day’s downside break of the 200-DMA to poke the lowest levels since mid-August 2022.
Also adding strength to the bearish bias is the pair’s sustained trading below the support-turned-resistance line from early June, as well as the bearish MACD signals.
That said, USD/CNH bears are on their way to meeting a downward-sloping support line from November 14, close to 6.7650 by the press time.
The pair’s further downside, however, appears limited as the 61.8% Fibonacci retracement level of its February-October upside, near 6.7150, could challenge the USD/CNH sellers afterward. If not, then the mid-2022 low surrounding 6.6170 and the 6.6000 round figure will be in focus.
On the contrary, recovery moves may initially aim for the 50.0% Fibonacci retracement level surrounding 6.8420 ahead of confronting the 200-DMA level of 6.8730.
Following that, the seven-month-old support-turned-resistance line near 6.9240 will be in focus as it holds the key to the USD/CNH run-up towards the 7.0000 psychological magnet.
Overall, USD/CNH remains on the bear’s radar even if the downside room appears limited.
Trend: Further downside expected
Technical Levels: Supports and Resistances
USDCNH currently trading at 6.7872 at the time of writing. Pair opened at 6.8276 and is trading with a change of -0.59% % .
| Overview | Overview.1 | |
|---|---|---|
| 0 | Today last price | 6.7872 |
| 1 | Today Daily Change | -0.0404 |
| 2 | Today Daily Change % | -0.59% |
| 3 | Today daily open | 6.8276 |
The pair remains strongly bearish on the daily time frame. It trades below the 20 SMA @ 6.9585, 50 SMA 7.0661, 100 SMA @ 7.0684 and 200 SMA @ 6.8709.
| Trends | Trends.1 | |
|---|---|---|
| 0 | Daily SMA20 | 6.9585 |
| 1 | Daily SMA50 | 7.0661 |
| 2 | Daily SMA100 | 7.0684 |
| 3 | Daily SMA200 | 6.8709 |
The previous day high was 6.8932 while the previous day low was 6.8236. The daily 38.2% Fib levels comes at 6.8502, expected to provide resistance. Similarly, the daily 61.8% fib level is at 6.8667, expected to provide resistance.
Note the levels of interest below:
- Pivot support is noted at 6.8031, 6.7786, 6.7335
- Pivot resistance is noted at 6.8727, 6.9178, 6.9423
| Levels | Levels.1 |
|---|---|
| Previous Daily High | 6.8932 |
| Previous Daily Low | 6.8236 |
| Previous Weekly High | 6.9396 |
| Previous Weekly Low | 6.8236 |
| Previous Monthly High | 7.0914 |
| Previous Monthly Low | 6.9050 |
| Daily Fibonacci 38.2% | 6.8502 |
| Daily Fibonacci 61.8% | 6.8667 |
| Daily Pivot Point S1 | 6.8031 |
| Daily Pivot Point S2 | 6.7786 |
| Daily Pivot Point S3 | 6.7335 |
| Daily Pivot Point R1 | 6.8727 |
| Daily Pivot Point R2 | 6.9178 |
| Daily Pivot Point R3 | 6.9423 |
[/s2If]
Join Our Telegram Group


