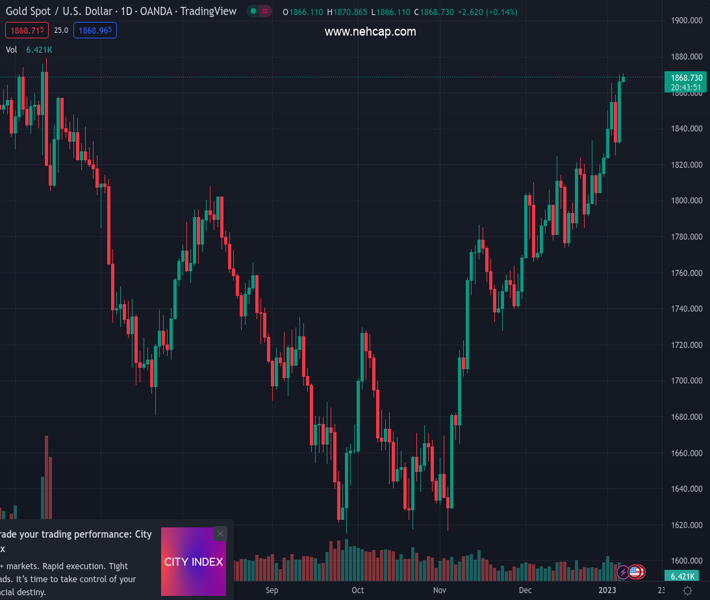
#XAUUSD @ 1,869.19 Gold price is facing barricades around $1,870.00, upside looks solid amid the volatile US Dollar Index. (Pivot Orderbook analysis)
…
This is a premium post.
[s2If !current_user_can(access_s2member_level4)]Please register for PREMIUM VERSION HERE to read full post below containing analysis. In case of any error or you think you are not able to read the full post below, please email us at support#nehcap.com [lwa][/s2If] [s2If current_user_can(access_s2member_level4)]
- Gold price is facing barricades around $1,870.00, upside looks solid amid the volatile US Dollar Index.
- S&P500 futures have added more gains in Friday’s rally, portraying an upbeat market mood.
- Gold price is getting much attention amid rising expectations of a recession in the United States.
The pair currently trades last at 1869.19.
The previous day high was 1869.91 while the previous day low was 1830.62. The daily 38.2% Fib levels comes at 1854.9, expected to provide support. Similarly, the daily 61.8% fib level is at 1845.63, expected to provide support.
Gold price (XAU/USD) is hovering in a narrow range around the immediate hurdle of $1,870 in the Asian session. The precious metal is looking to extend its upside journey amid the higher risk appetite of the market participants.
S&P500 futures have added more gains in Friday’s rally, portraying an upbeat market mood. The US Dollar Index (DXY) has sensed barricades around 103.50 and is going to find an intermediate cushion around 103.00. The 10-year US Treasury yields have dropped to near 3.56% amid a decline in safe-haven’s appeal.
Gold price is getting much attention amid rising expectations of a recession in the United States. After a consecutive drop in the US ISM Manufacturing PMI, the Services PMI has also slipped too, indicating that the overall demand in the United States economy has weakened. The Services PMI plunged significantly to 49.6 vs. the projection of 55.0. Also, New Orders Index that displays forward demand dropped massively to 45.2 vs. the expectations of 58.5. A sheer slowdown in economic activities and its forward projections are impacting the US Dollar.
Gold price has delivered an upside break of the horizontal resistance plotted from January 4 high at $1,865.15 on an hourly scale, which will act as major support ahead. The 20-and 50-period Exponential Moving Averages (EMAs) have delivered a bull cross around $1,840.58, which adds to the upside filters.
Also, the Relative Strength Index (RSI) (14) has shifted into the bullish range of 60.00-80.00, which indicates that the bullish momentum has been triggered.
Technical Levels: Supports and Resistances
XAUUSD currently trading at 1868.6 at the time of writing. Pair opened at 1866.99 and is trading with a change of 0.09 % .
| Overview | Overview.1 | |
|---|---|---|
| 0 | Today last price | 1868.60 |
| 1 | Today Daily Change | 1.61 |
| 2 | Today Daily Change % | 0.09 |
| 3 | Today daily open | 1866.99 |
The pair remains strongly bullish on the daily timeframe. It trades above its 20 SMA @ 1812.3, 50 SMA 1768.68, 100 SMA @ 1726.95 and 200 SMA @ 1778.09.
| Trends | Trends.1 | |
|---|---|---|
| 0 | Daily SMA20 | 1812.30 |
| 1 | Daily SMA50 | 1768.68 |
| 2 | Daily SMA100 | 1726.95 |
| 3 | Daily SMA200 | 1778.09 |
The previous day high was 1869.91 while the previous day low was 1830.62. The daily 38.2% Fib levels comes at 1854.9, expected to provide support. Similarly, the daily 61.8% fib level is at 1845.63, expected to provide support.
Note the levels of interest below:
- Pivot support is noted at 1841.77, 1816.55, 1802.48
- Pivot resistance is noted at 1881.06, 1895.13, 1920.35
| Levels | Levels.1 |
|---|---|
| Previous Daily High | 1869.91 |
| Previous Daily Low | 1830.62 |
| Previous Weekly High | 1869.91 |
| Previous Weekly Low | 1823.76 |
| Previous Monthly High | 1833.38 |
| Previous Monthly Low | 1765.89 |
| Daily Fibonacci 38.2% | 1854.90 |
| Daily Fibonacci 61.8% | 1845.63 |
| Daily Pivot Point S1 | 1841.77 |
| Daily Pivot Point S2 | 1816.55 |
| Daily Pivot Point S3 | 1802.48 |
| Daily Pivot Point R1 | 1881.06 |
| Daily Pivot Point R2 | 1895.13 |
| Daily Pivot Point R3 | 1920.35 |
[/s2If]
Join Our Telegram Group


