US Dollar Index takes offers to refresh intraday low, extends Friday’s U-turn from one-month high. (Pivot Orderbook analysis)
…
This is a premium post.
[s2If !current_user_can(access_s2member_level4)]Please register for PREMIUM VERSION HERE to read full post below containing analysis. In case of any error or you think you are not able to read the full post below, please email us at support#nehcap.com [lwa][/s2If] [s2If current_user_can(access_s2member_level4)]
- US Dollar Index takes offers to refresh intraday low, extends Friday’s U-turn from one-month high.
- China’s reopening of national border, growth optimism at PBOC underpin risk-on mood.
- Fed officials struggle to defend hawkish bias after recently mixed US data.
- US CPI will be crucial for policy hawks amid chatters of easing inflation fears.
The pair currently trades last at 103.74.
The previous day high was 105.63 while the previous day low was 103.87. The daily 38.2% Fib levels comes at 104.54, expected to provide resistance. Similarly, the daily 61.8% fib level is at 104.96, expected to provide resistance.
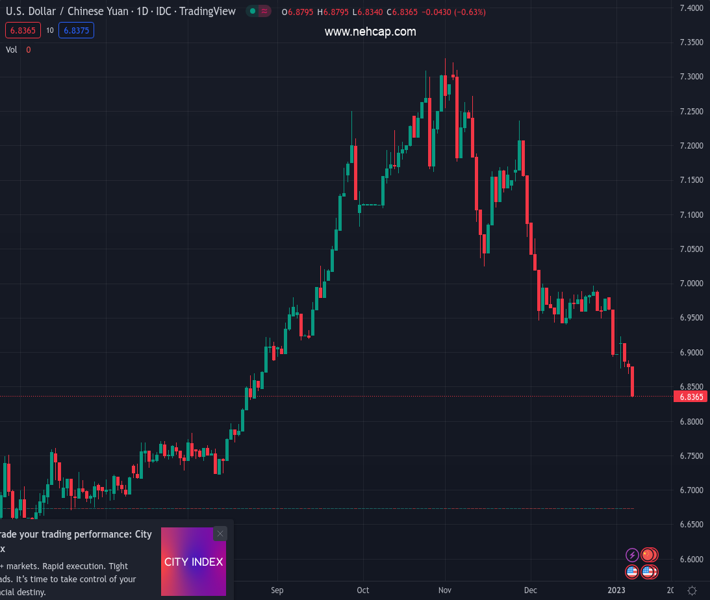
US Dollar Index (DXY) renews its intraday low near 103.75 as it extends the previous day’s U-turn from a three-week high during Monday’s Asian session. In doing so, the DXY bears cheer upbeat sentiment, as well as mixed concerns, surrounding the US Federal Reserve’s (Fed) next move.
That said, the risk-positive headlines from China, one of the world’s biggest commodity users, favor the market’s upbeat sentiment as Beijing reopens national borders after a three-year pause. On the same line could be the early signals suggesting China’s heavy shopping during the festive season, as well as comments from People’s Bank of China (PBOC) Official suggesting optimism surrounding China’s growth conditions.
On the other hand, downbeat prints of the US wage growth, ISM Services PMI and the Factory Orders drowned the Treasury bond yields, as well as the US Dollar Index (DXY) the previous day. However, the headline US Nonfarm Payrolls and Unemployment Rate printed impressive figures for December.
Following the mixed data, Atlanta Federal Reserve President Raphael Bostic highlighted the fears of the US economic slowdown while outgoing Chicago Fed President Charles Evans favored a 0.50% rate hike in December. Further, Kansas City Fed President Esther George highlighted inflation fears whereas Richmond Federal Reserve Bank President Thomas Barkin praised the last two months of inflation reports by terming them as “a step in the right direction,” but marked fears from the higher median figures.
Amid these plays, Wall Street closed positive while the US 10-year Treasury yields dropped 16 basis points (bps) to 3.56%, the lowest levels in three weeks. It’s worth noting that the S&P 500 Futures print 0.20% intraday gains by the press time.
Moving on, the mixed US data and a slump in the United States Treasury bond yields highlight Thursday’s US Consumer Price Index (CPI) for December as firmer inflation numbers could shift focus on hawkish Fed bets and can trigger the DXY’s corrective bounce.
US Dollar Index extends the previous day’s U-turn from a 200-day EMA hurdle, around 105.62 by the press time, which in turn joins downbeat oscillators to direct DXY bears towards December’s low surrounding 103.40.
Technical Levels: Supports and Resistances
USDCNY currently trading at 103.74 at the time of writing. Pair opened at 103.9 and is trading with a change of -0.15% % .
| Overview | Overview.1 | |
|---|---|---|
| 0 | Today last price | 103.74 |
| 1 | Today Daily Change | -0.16 |
| 2 | Today Daily Change % | -0.15% |
| 3 | Today daily open | 103.9 |
The pair remains strongly bearish on the daily time frame. It trades below the 20 SMA @ 104.29, 50 SMA 105.3, 100 SMA @ 108.28 and 200 SMA @ 106.79.
| Trends | Trends.1 | |
|---|---|---|
| 0 | Daily SMA20 | 104.29 |
| 1 | Daily SMA50 | 105.30 |
| 2 | Daily SMA100 | 108.28 |
| 3 | Daily SMA200 | 106.79 |
The previous day high was 105.63 while the previous day low was 103.87. The daily 38.2% Fib levels comes at 104.54, expected to provide resistance. Similarly, the daily 61.8% fib level is at 104.96, expected to provide resistance.
Note the levels of interest below:
- Pivot support is noted at 103.3, 102.7, 101.54
- Pivot resistance is noted at 105.06, 106.22, 106.82
| Levels | Levels.1 |
|---|---|
| Previous Daily High | 105.63 |
| Previous Daily Low | 103.87 |
| Previous Weekly High | 105.63 |
| Previous Weekly Low | 103.43 |
| Previous Monthly High | 106.02 |
| Previous Monthly Low | 103.39 |
| Daily Fibonacci 38.2% | 104.54 |
| Daily Fibonacci 61.8% | 104.96 |
| Daily Pivot Point S1 | 103.30 |
| Daily Pivot Point S2 | 102.70 |
| Daily Pivot Point S3 | 101.54 |
| Daily Pivot Point R1 | 105.06 |
| Daily Pivot Point R2 | 106.22 |
| Daily Pivot Point R3 | 106.82 |
[/s2If]
Join Our Telegram Group


