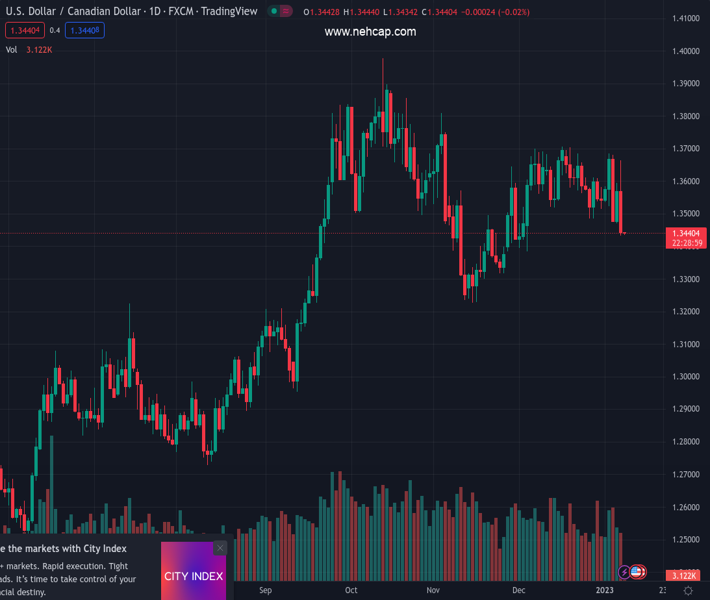
#USDCAD @ 1.34420 is expected to remain rangebound till the release of a potential trigger ahead. (Pivot Orderbook analysis)
…
This is a premium post.
[s2If !current_user_can(access_s2member_level4)]Please register for PREMIUM VERSION HERE to read full post below containing analysis. In case of any error or you think you are not able to read the full post below, please email us at support#nehcap.com [lwa][/s2If] [s2If current_user_can(access_s2member_level4)]
- USD/CAD is expected to remain rangebound till the release of a potential trigger ahead.
- The catalyst that has triggered volatility for the USD index is the weak Average Hourly Earnings data.
- Oil prices remain sideways amid ambiguity over the Covid situation in the Chinese economy.
The pair currently trades last at 1.34420.
The previous day high was 1.3664 while the previous day low was 1.3433. The daily 38.2% Fib levels comes at 1.3522, expected to provide resistance. Similarly, the daily 61.8% fib level is at 1.3576, expected to provide resistance.
The USD/CAD pair is displaying a sideways profile below 1.3450 in the early Tokyo session. A rangebound action is expected from the Loonie asset as sheer volatility is generally followed by volatility contraction.
A significant improvement in the risk appetite of the market participants after a decline in the United States Average Hourly Earnings strengthened risk-sensitive assets such as S&P500. The 500-stock US basket snapped its 10-day subdued performance and jumped heavily. While the US Dollar Index (DXY) witnessed carnage amid a decline in safe-haven’s appeal. The return on 10-year US Treasury bonds witnessed a marginal sell-off and dropped to 3.56%.
An upbeat US Nonfarm Payrolls (NFP) was already expected by the market participants after a solid addition of payrolls in December reported by the US Automatic Data Processing (ADP) Employment Change. The catalyst that triggered volatility in the USD Index was the decline in Average Hourly Earnings to 4.6% vs. the expectations of 5.0%. This might support a further downward shift in the extent of an interest rate hike by the Federal Reserve (Fed).
Chicago Fed President Evans quoted in Wall Street Journal (WSJ), “It was possible the economic data would support raising the policy rate by 25 basis points at the Fed’s next gathering” as reported by Reuters.
On the Canadian Dollar front, Net Change in Employment released stronger-than-anticipated at 104K than the consensus of 8K and the prior release of 10.4K. The Unemployment Rate dropped to 5.0% along with Average Hourly Wages (Dec) which was trimmed to 5.2%. This is going to create hurdles for the Bank of Canada (BoC) ahead.
Meanwhile, oil prices are struggling to find direction from the $73.00-75.00 range. Investors are in a fix on whether to support black gold considering an improvement in long-term economic projections of the Chinese economy due to reopening or to punish for short-term pain in oil demand led by a spike in Covid-19 infections.
Technical Levels: Supports and Resistances
USDCAD currently trading at 1.3445 at the time of writing. Pair opened at 1.3444 and is trading with a change of 0.01 % .
| Overview | Overview.1 | |
|---|---|---|
| 0 | Today last price | 1.3445 |
| 1 | Today Daily Change | 0.0001 |
| 2 | Today Daily Change % | 0.0100 |
| 3 | Today daily open | 1.3444 |
The pair is trading below its 20 Daily moving average @ 1.3588, below its 50 Daily moving average @ 1.3522 , below its 100 Daily moving average @ 1.3476 and above its 200 Daily moving average @ 1.3148
| Trends | Trends.1 | |
|---|---|---|
| 0 | Daily SMA20 | 1.3588 |
| 1 | Daily SMA50 | 1.3522 |
| 2 | Daily SMA100 | 1.3476 |
| 3 | Daily SMA200 | 1.3148 |
The previous day high was 1.3664 while the previous day low was 1.3433. The daily 38.2% Fib levels comes at 1.3522, expected to provide resistance. Similarly, the daily 61.8% fib level is at 1.3576, expected to provide resistance.
Note the levels of interest below:
- Pivot support is noted at 1.3364, 1.3283, 1.3132
- Pivot resistance is noted at 1.3595, 1.3745, 1.3826
| Levels | Levels.1 |
|---|---|
| Previous Daily High | 1.3664 |
| Previous Daily Low | 1.3433 |
| Previous Weekly High | 1.3685 |
| Previous Weekly Low | 1.3433 |
| Previous Monthly High | 1.3705 |
| Previous Monthly Low | 1.3385 |
| Daily Fibonacci 38.2% | 1.3522 |
| Daily Fibonacci 61.8% | 1.3576 |
| Daily Pivot Point S1 | 1.3364 |
| Daily Pivot Point S2 | 1.3283 |
| Daily Pivot Point S3 | 1.3132 |
| Daily Pivot Point R1 | 1.3595 |
| Daily Pivot Point R2 | 1.3745 |
| Daily Pivot Point R3 | 1.3826 |
[/s2If]
Join Our Telegram Group


