#GBPUSD @ 1.20862 struggles to defend the previous day’s bounce off seven-week low., @nehcap view: Further upside expected (Pivot Orderbook analysis)
…
This is a premium post.
[s2If !current_user_can(access_s2member_level4)]Please register for PREMIUM VERSION HERE to read full post below containing analysis. In case of any error or you think you are not able to read the full post below, please email us at support#nehcap.com [lwa][/s2If] [s2If current_user_can(access_s2member_level4)]
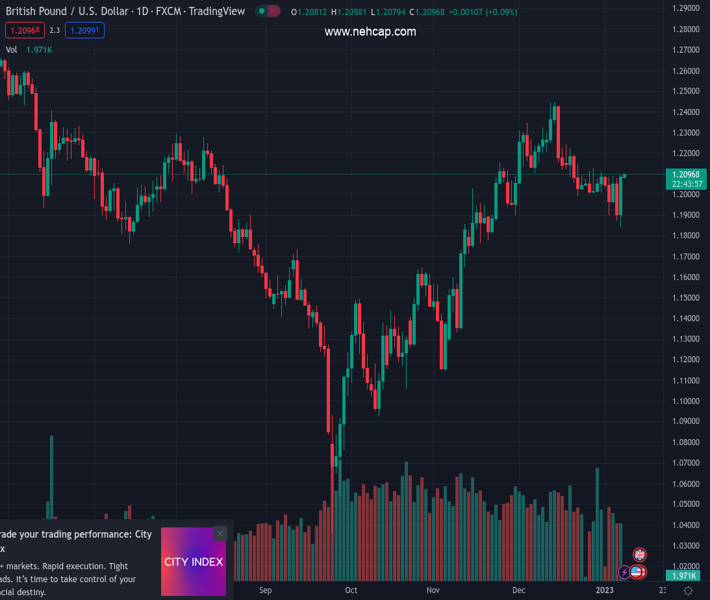
- GBP/USD struggles to defend the previous day’s bounce off seven-week low.
- Sustained break of three-week-old descending trend line, 100-SMA favor buyers.
- Bullish MACD signals, firmer RSI also underpin bullish bias.
- Sellers need validation from 1.2050 to retake control.
The pair currently trades last at 1.20862.
The previous day high was 1.21 while the previous day low was 1.1841. The daily 38.2% Fib levels comes at 1.2001, expected to provide support. Similarly, the daily 61.8% fib level is at 1.194, expected to provide support.
GBP/USD bulls flirt with the 1.2100 threshold during Monday’s Asian session, after posting the biggest daily jump in five weeks on Friday. Even so, the Cable pair remains on the bull’s radar as it defends the previous day’s technical breakouts.
Not only the upside break of a descending resistance line from December 19, as well as the 100-SMA, but the bullish MACD signals and firmer RSI (14) also keep the GBP/USD buyers hopeful.
However, the 200-SMA level surrounding 1.2125 challenges the quote’s immediate advances.
Following that, the 1.2200 round figure and the late December swing high near 1.2245 could act as additional upside filters before directing previous toward the previous monthly top of 1.2446.
It’s worth noting, that December 05 swing high near 1.2345 acts as an extra filter towards the north.
On the flip side, the 100-SMA and the resistance-turned-support line, respectively around 1.2075 and 1.2050, put a short-term floor under the GBP/USD prices.
In a case where the quote drops below 1.2050, a slump toward 1.2000 becomes imminent.
Though, the latest swing low around 1.1840 could challenge the GBP/USD bears afterward.
Trend: Further upside expected
Technical Levels: Supports and Resistances
GBPUSD currently trading at 1.2092 at the time of writing. Pair opened at 1.2095 and is trading with a change of -0.02% % .
| Overview | Overview.1 | |
|---|---|---|
| 0 | Today last price | 1.2092 |
| 1 | Today Daily Change | -0.0003 |
| 2 | Today Daily Change % | -0.02% |
| 3 | Today daily open | 1.2095 |
The pair is trading below its 20 Daily moving average @ 1.2111, above its 50 Daily moving average @ 1.1957 , above its 100 Daily moving average @ 1.1669 and above its 200 Daily moving average @ 1.2019
| Trends | Trends.1 | |
|---|---|---|
| 0 | Daily SMA20 | 1.2111 |
| 1 | Daily SMA50 | 1.1957 |
| 2 | Daily SMA100 | 1.1669 |
| 3 | Daily SMA200 | 1.2019 |
The previous day high was 1.21 while the previous day low was 1.1841. The daily 38.2% Fib levels comes at 1.2001, expected to provide support. Similarly, the daily 61.8% fib level is at 1.194, expected to provide support.
Note the levels of interest below:
- Pivot support is noted at 1.1925, 1.1754, 1.1667
- Pivot resistance is noted at 1.2183, 1.227, 1.2441
| Levels | Levels.1 |
|---|---|
| Previous Daily High | 1.2100 |
| Previous Daily Low | 1.1841 |
| Previous Weekly High | 1.2102 |
| Previous Weekly Low | 1.1841 |
| Previous Monthly High | 1.2447 |
| Previous Monthly Low | 1.1992 |
| Daily Fibonacci 38.2% | 1.2001 |
| Daily Fibonacci 61.8% | 1.1940 |
| Daily Pivot Point S1 | 1.1925 |
| Daily Pivot Point S2 | 1.1754 |
| Daily Pivot Point S3 | 1.1667 |
| Daily Pivot Point R1 | 1.2183 |
| Daily Pivot Point R2 | 1.2270 |
| Daily Pivot Point R3 | 1.2441 |
[/s2If]
Join Our Telegram Group


