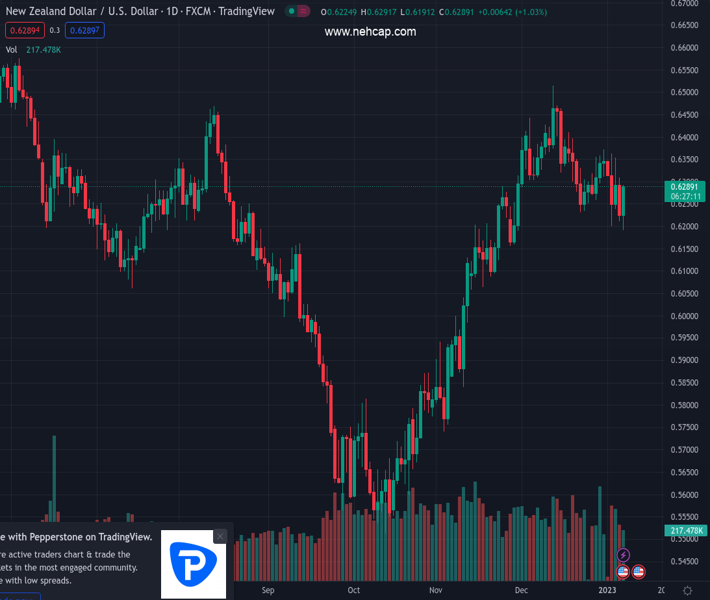
#NZDUSD @ 0.62893 Greenback drops sharply after NFP and ISM service sector. (Pivot Orderbook analysis)
…
This is a premium post.
[s2If !current_user_can(access_s2member_level4)]Please register for PREMIUM VERSION HERE to read full post below containing analysis. In case of any error or you think you are not able to read the full post below, please email us at support#nehcap.com [lwa][/s2If] [s2If current_user_can(access_s2member_level4)]
- Greenback drops sharply after NFP and ISM service sector.
- US yield falls to multi-day lows, commodities rebound.
- NZD/USD reverses from monthly lows, and trims weekly losses.
The pair currently trades last at 0.62893.
The previous day high was 0.6341 while the previous day low was 0.621. The daily 38.2% Fib levels comes at 0.626, expected to provide support. Similarly, the daily 61.8% fib level is at 0.6291, expected to provide resistance.
The NZD/USD has risen a hundred pips from the daily low and it is trading at 0.6290, with a solid bullish tone supported by a broad-based USD decline.
The greenback turned to the downside after the release of the Nonfarm Payrolls report that came in above expectations. After a brief recovery, it resumed the downside following the ISM Service Sector report for December that showed a larger than expected slide.
Following the numbers, US yields tumbled with the 10-year falling from 3.75% to 3.61%, the lowest level since December 20. The DXY reversed sharply from one-month highs above 105.50 to under 104.50, turning negative for the day, but still positive for the week.
The NZD/USD is looking at the 0.6300 zone and toward the next resistance that stands at 0.6310 (Jan 5 high). Above attention would turn to 0.6355/60, a critical area that capped the upside several times. A consolidation above 0.6360 should open the doors to more gains. On the flip side, 0.6250 is the immediate support, followed by 0.6215.
Technical Levels: Supports and Resistances
NZDUSD currently trading at 0.6269 at the time of writing. Pair opened at 0.6229 and is trading with a change of 0.64 % .
| Overview | Overview.1 | |
|---|---|---|
| 0 | Today last price | 0.6269 |
| 1 | Today Daily Change | 0.0040 |
| 2 | Today Daily Change % | 0.6400 |
| 3 | Today daily open | 0.6229 |
The pair is trading below its 20 Daily moving average @ 0.6333, above its 50 Daily moving average @ 0.62 , above its 100 Daily moving average @ 0.6038 and above its 200 Daily moving average @ 0.6228
| Trends | Trends.1 | |
|---|---|---|
| 0 | Daily SMA20 | 0.6333 |
| 1 | Daily SMA50 | 0.6200 |
| 2 | Daily SMA100 | 0.6038 |
| 3 | Daily SMA200 | 0.6228 |
The previous day high was 0.6341 while the previous day low was 0.621. The daily 38.2% Fib levels comes at 0.626, expected to provide support. Similarly, the daily 61.8% fib level is at 0.6291, expected to provide resistance.
Note the levels of interest below:
- Pivot support is noted at 0.6179, 0.6129, 0.6047
- Pivot resistance is noted at 0.631, 0.6391, 0.6442
| Levels | Levels.1 |
|---|---|
| Previous Daily High | 0.6341 |
| Previous Daily Low | 0.6210 |
| Previous Weekly High | 0.6373 |
| Previous Weekly Low | 0.6253 |
| Previous Monthly High | 0.6514 |
| Previous Monthly Low | 0.6230 |
| Daily Fibonacci 38.2% | 0.6260 |
| Daily Fibonacci 61.8% | 0.6291 |
| Daily Pivot Point S1 | 0.6179 |
| Daily Pivot Point S2 | 0.6129 |
| Daily Pivot Point S3 | 0.6047 |
| Daily Pivot Point R1 | 0.6310 |
| Daily Pivot Point R2 | 0.6391 |
| Daily Pivot Point R3 | 0.6442 |
[/s2If]
Join Our Telegram Group


