#XAUUSD @ 1,852.56 Gold price is displaying a sideways profile on a broader note ahead of US Employment data. (Pivot Orderbook analysis)
…
This is a premium post.
[s2If !current_user_can(access_s2member_level4)]Please register for PREMIUM VERSION HERE to read full post below containing analysis. In case of any error or you think you are not able to read the full post below, please email us at support#nehcap.com [lwa][/s2If] [s2If current_user_can(access_s2member_level4)]
- Gold price is displaying a sideways profile on a broader note ahead of US Employment data.
- As per FOMC minutes, no Fed policymaker has advocated for cutting rates in CY2023.
- A sheer drop in US NFP and a higher Unemployment Rate could trigger recession fears.
The pair currently trades last at 1852.56.
The previous day high was 1865.15 while the previous day low was 1836.25. The daily 38.2% Fib levels comes at 1854.11, expected to provide resistance. Similarly, the daily 61.8% fib level is at 1847.29, expected to provide support.
Gold price (XAU/USD) has failed to capitalize on a firmer rally to near $1,860.00 and has corrected gradually to near $1,850.00 in the early European session. The precious metal is likely to continue its lackluster performance till the release of the United States Nonfarm Payrolls (NFP) data.
The risk profile is improving again as S&P500 futures have recovered a majority of losses recorded in the Asian session. Contrary to it, the 10-year US Treasury yields have climbed above 3.72%, portraying ambiguity in market sentiment. The US Dollar Index (DXY) is aiming to surpass the immediate resistance of 140.00.
After the release of the Federal Open Market Committee (FOMC) minutes, which has cleared that no Federal Reserve (Fed) policymaker has advocated for cutting interest rates in CY2023, the street is looking for United States employment data. Only a significant drop in the employment addition numbers and an increase in the Unemployment Rate could force the Fed to look for policy stability or easing it to dodge recession fears.
On an hourly scale, Gold price is auctioning in a Symmetrical Triangle chart pattern that signals volatility contraction. It is highly likely that the release of the US Automatic Data Processing (ADP) Employment Change data will result in a volatility breakout.
Overlapping 20-period Exponential Moving Average (EMA) at $1,853.84 with the Gold price indicates rangebound action. Upward-sloping 50-EMA at $1,846.79 indicates that the short-term trend is still bullish.
Meanwhile, the Relative Strength Index (RSI) (14) has shifted into the 40.00-60.00 range from the bullish range of 60.00-80.00, which indicates a loss in the upside momentum.
Technical Levels: Supports and Resistances
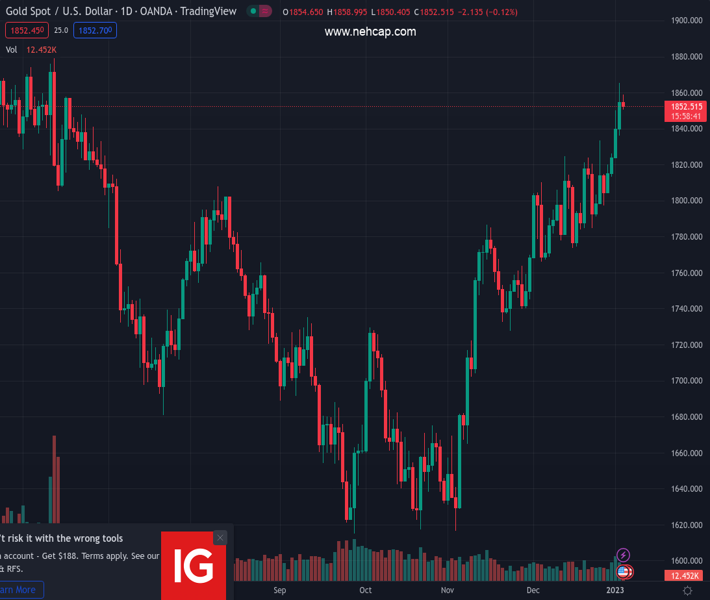
XAUUSD currently trading at 1852.89 at the time of writing. Pair opened at 1855.38 and is trading with a change of -0.13 % .
| Overview | Overview.1 | |
|---|---|---|
| 0 | Today last price | 1852.89 |
| 1 | Today Daily Change | -2.49 |
| 2 | Today Daily Change % | -0.13 |
| 3 | Today daily open | 1855.38 |
The pair remains strongly bullish on the daily timeframe. It trades above its 20 SMA @ 1806.47, 50 SMA 1760.84, 100 SMA @ 1725.02 and 200 SMA @ 1778.94.
| Trends | Trends.1 | |
|---|---|---|
| 0 | Daily SMA20 | 1806.47 |
| 1 | Daily SMA50 | 1760.84 |
| 2 | Daily SMA100 | 1725.02 |
| 3 | Daily SMA200 | 1778.94 |
The previous day high was 1865.15 while the previous day low was 1836.25. The daily 38.2% Fib levels comes at 1854.11, expected to provide resistance. Similarly, the daily 61.8% fib level is at 1847.29, expected to provide support.
Note the levels of interest below:
- Pivot support is noted at 1839.37, 1823.36, 1810.47
- Pivot resistance is noted at 1868.27, 1881.16, 1897.17
| Levels | Levels.1 |
|---|---|
| Previous Daily High | 1865.15 |
| Previous Daily Low | 1836.25 |
| Previous Weekly High | 1833.38 |
| Previous Weekly Low | 1797.11 |
| Previous Monthly High | 1833.38 |
| Previous Monthly Low | 1765.89 |
| Daily Fibonacci 38.2% | 1854.11 |
| Daily Fibonacci 61.8% | 1847.29 |
| Daily Pivot Point S1 | 1839.37 |
| Daily Pivot Point S2 | 1823.36 |
| Daily Pivot Point S3 | 1810.47 |
| Daily Pivot Point R1 | 1868.27 |
| Daily Pivot Point R2 | 1881.16 |
| Daily Pivot Point R3 | 1897.17 |
[/s2If]
Join Our Telegram Group


