#AUDJPY @ 90.4450 The rallied more than 2.90% on Wednesday on an upbeat sentiment. (Pivot Orderbook analysis)
…
This is a premium post.
[s2If !current_user_can(access_s2member_level4)]Please register for PREMIUM VERSION HERE to read full post below containing analysis. In case of any error or you think you are not able to read the full post below, please email us at support#nehcap.com [lwa][/s2If] [s2If current_user_can(access_s2member_level4)]
- The AUD/JPY rallied more than 2.90% on Wednesday on an upbeat sentiment.
- Double bottom in the AUD/JPY daily chart could pave the way for further upside.
- AUD/JPY Price Analysis: The double bottom targeted is the 95.00 figure.
The pair currently trades last at 90.4450.
The previous day high was 89.33 while the previous day low was 87.41. The daily 38.2% Fib levels comes at 88.14, expected to provide support. Similarly, the daily 61.8% fib level is at 88.6, expected to provide support.
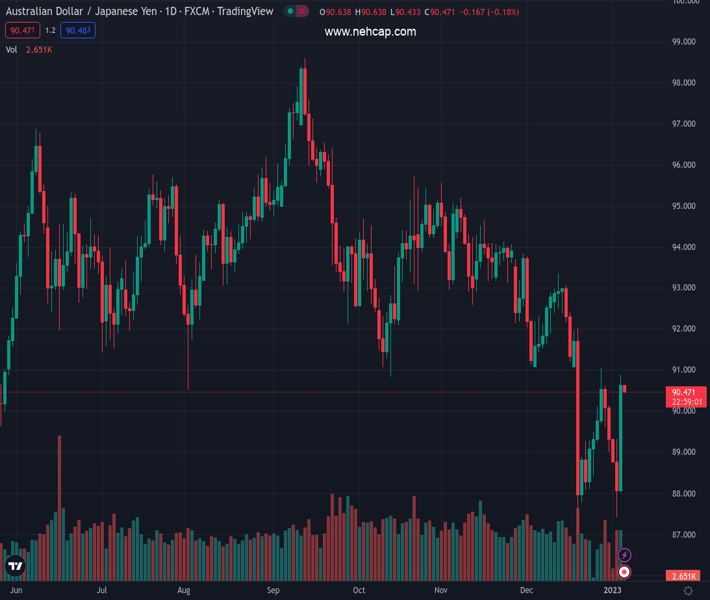
The Australian Dollar (AUD) registered staggering gains against the Japanese Yen (JPY) on Wednesday, rallied 250 pips, further cementing the case for a double bottom in the daily chart. As the Asian session begins, the AUD/JPY is trading with minuscule losses of 0.05%, at 90.47.
Wednesday’s price action presented the AUD/JPY rising above the 20-day Exponential Moving Average (EMA) at 90.33, and on the rally, it approached December’s monthly high of 91.05. Now that the AUD/JPY pair confirmed the double bottom, a clear break of the latter would pave the path towards the double bottom measured target of 95.00. Oscillators like the Relative Strength Index (RSI) is about to cross over the 50 mid-line, a bullish signal, while the Rate of Change (RoC) suggests that buying pressure is building.
Therefore, the AUD/JPY first resistance would be the confluence of the 50 and 200-day EMA around 91.66. Once cleared, that would expose the 92.00 figure, followed by the 100-day EMA at 92.42.
As an alternate scenario, the AUD/JPY first support would be the 90.00 mark, which, once cleared, could open the door for a fall to January’s three daily high-turned-support once broken, at 89.32. Break below would send the AUD/JPY sliding to 89.00.
Technical Levels: Supports and Resistances
AUDJPY currently trading at 90.59 at the time of writing. Pair opened at 88.12 and is trading with a change of 2.8 % .
| Overview | Overview.1 | |
|---|---|---|
| 0 | Today last price | 90.59 |
| 1 | Today Daily Change | 2.47 |
| 2 | Today Daily Change % | 2.80 |
| 3 | Today daily open | 88.12 |
The pair remains strongly bearish on the daily time frame. It trades below the 20 SMA @ 90.6, 50 SMA 92.44, 100 SMA @ 93.53 and 200 SMA @ 93.26.
| Trends | Trends.1 | |
|---|---|---|
| 0 | Daily SMA20 | 90.60 |
| 1 | Daily SMA50 | 92.44 |
| 2 | Daily SMA100 | 93.53 |
| 3 | Daily SMA200 | 93.26 |
The previous day high was 89.33 while the previous day low was 87.41. The daily 38.2% Fib levels comes at 88.14, expected to provide support. Similarly, the daily 61.8% fib level is at 88.6, expected to provide support.
Note the levels of interest below:
- Pivot support is noted at 87.25, 86.37, 85.33
- Pivot resistance is noted at 89.16, 90.2, 91.07
| Levels | Levels.1 |
|---|---|
| Previous Daily High | 89.33 |
| Previous Daily Low | 87.41 |
| Previous Weekly High | 91.06 |
| Previous Weekly Low | 89.02 |
| Previous Monthly High | 93.81 |
| Previous Monthly Low | 87.02 |
| Daily Fibonacci 38.2% | 88.14 |
| Daily Fibonacci 61.8% | 88.60 |
| Daily Pivot Point S1 | 87.25 |
| Daily Pivot Point S2 | 86.37 |
| Daily Pivot Point S3 | 85.33 |
| Daily Pivot Point R1 | 89.16 |
| Daily Pivot Point R2 | 90.20 |
| Daily Pivot Point R3 | 91.07 |
[/s2If]
Join Our Telegram Group


