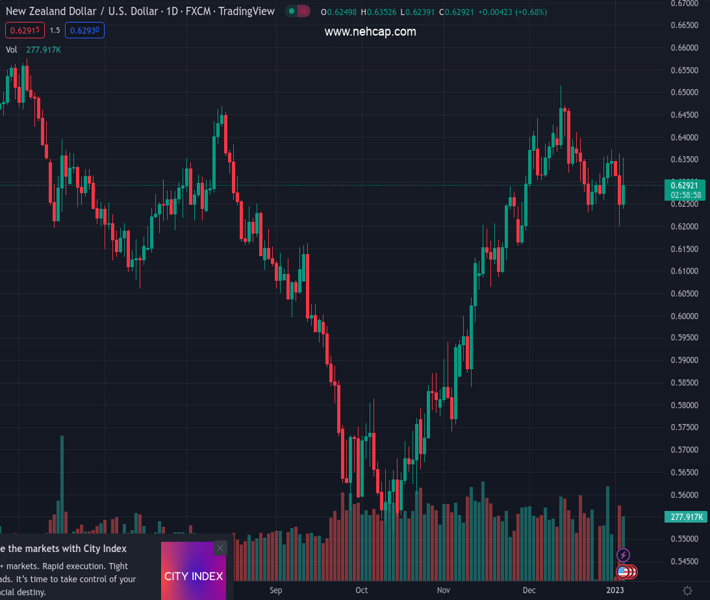
#NZDUSD @ 0.62918 The rises courtesy of an improvement in market sentiment. (Pivot Orderbook analysis)
…
This is a premium post.
[s2If !current_user_can(access_s2member_level4)]Please register for PREMIUM VERSION HERE to read full post below containing analysis. In case of any error or you think you are not able to read the full post below, please email us at support#nehcap.com [lwa][/s2If] [s2If current_user_can(access_s2member_level4)]
- The NZD/USD rises courtesy of an improvement in market sentiment.
- US economic data was mixed with prices easing, while the labor market remains tight, supporting further Fed tightening.
- Minnesota Fed’s Kashkari foresees rates peaking at around 5.4%.
The pair currently trades last at 0.62918.
The previous day high was 0.6363 while the previous day low was 0.6199. The daily 38.2% Fib levels comes at 0.6262, expected to provide support. Similarly, the daily 61.8% fib level is at 0.63, expected to provide resistance.
The New Zealand Dollar (NZD) snapped two days of losses against the US Dollar (USD), as economic data released in the United States (US), showed the labor market remains tight while manufacturing activity continues to contract. All this in an upbeat mood spurred on China’s news. At the time of writing, the NZD/USD is trading at 0.6299..
Traders’ mood remains optimistic as high beta currencies rose. The NZD/USD slipped from daily highs around 0.6352 at the release of mixed US economic data. The Institute for Supply Management (ISM) revealed that Manufacturing PMI for December dropped to 48.4, exceeding estimates for a fall to 48.5, extending its downtrend for the second consecutive month. The report highlighted that prices and demand are slowing, a welcomed development for the Federal Reserve (Fed), while the employment subcomponent expanded, implying the tightness of the labor market.
At the same time, the November US JOLTs reported that vacancies rose to 10.458M, higher than the 10.0M estimated by analysts. October figures were upward revised to 10.512M, almost 200K more than the reported data, further cementing the case for additional Fed action.
Meanwhile, Minnesota’s Fed President Neil Kashkari (voter in 2023) said that it would be appropriate to continue to hike rates “at least at the next few meetings” until inflation has peaked and foresees the Federal Funds rate (FFR) at 5.4%. He added that the Fed must avoid cutting the policy rate prematurely and would consider cutting only when it’s convinced inflation is on its way back down to 2%.
Aside from this, the NZD/USD resumed its upward trajectory, though it is seesawing around the 20-day Exponential Moving Average (EMA) at 0.6301. if the NZD/USD achieves a daily close above the latter, further upside is expected. Contrarily, the NZD/USD might retest the 50-day EMA at 0.6209.
What to watch
An absent New Zealand (NZ) economic docket would leave traders adrift to US dynamics. The US economic calendar would feature the US Federal Reserve’s (Fed) last meeting minutes, followed by the Balance of Trade and the Initial Jobless Claims report on Thursday, ahead of the US Nonfarm Payrolls report on Friday.
Technical Levels: Supports and Resistances
NZDUSD currently trading at 0.6297 at the time of writing. Pair opened at 0.6247 and is trading with a change of 0.8 % .
| Overview | Overview.1 | |
|---|---|---|
| 0 | Today last price | 0.6297 |
| 1 | Today Daily Change | 0.0050 |
| 2 | Today Daily Change % | 0.8000 |
| 3 | Today daily open | 0.6247 |
The pair is trading below its 20 Daily moving average @ 0.6343, above its 50 Daily moving average @ 0.6183 , above its 100 Daily moving average @ 0.6039 and above its 200 Daily moving average @ 0.6234
| Trends | Trends.1 | |
|---|---|---|
| 0 | Daily SMA20 | 0.6343 |
| 1 | Daily SMA50 | 0.6183 |
| 2 | Daily SMA100 | 0.6039 |
| 3 | Daily SMA200 | 0.6234 |
The previous day high was 0.6363 while the previous day low was 0.6199. The daily 38.2% Fib levels comes at 0.6262, expected to provide support. Similarly, the daily 61.8% fib level is at 0.63, expected to provide resistance.
Note the levels of interest below:
- Pivot support is noted at 0.6176, 0.6106, 0.6012
- Pivot resistance is noted at 0.634, 0.6434, 0.6504
| Levels | Levels.1 |
|---|---|
| Previous Daily High | 0.6363 |
| Previous Daily Low | 0.6199 |
| Previous Weekly High | 0.6373 |
| Previous Weekly Low | 0.6253 |
| Previous Monthly High | 0.6514 |
| Previous Monthly Low | 0.6230 |
| Daily Fibonacci 38.2% | 0.6262 |
| Daily Fibonacci 61.8% | 0.6300 |
| Daily Pivot Point S1 | 0.6176 |
| Daily Pivot Point S2 | 0.6106 |
| Daily Pivot Point S3 | 0.6012 |
| Daily Pivot Point R1 | 0.6340 |
| Daily Pivot Point R2 | 0.6434 |
| Daily Pivot Point R3 | 0.6504 |
[/s2If]
Join Our Telegram Group
")


