#EURUSD @ 1.06163 November’s US JOLTs report exceeded estimates, and upward revisions to October’s report suggest the labor market remains tight. (Pivot Orderbook analysis)
…
This is a premium post.
[s2If !current_user_can(access_s2member_level4)]Please register for PREMIUM VERSION HERE to read full post below containing analysis. In case of any error or you think you are not able to read the full post below, please email us at support#nehcap.com [lwa][/s2If] [s2If current_user_can(access_s2member_level4)]
- November’s US JOLTs report exceeded estimates, and upward revisions to October’s report suggest the labor market remains tight.
- US ISM Manufacturing PMI for December contracted for the second consecutive month.
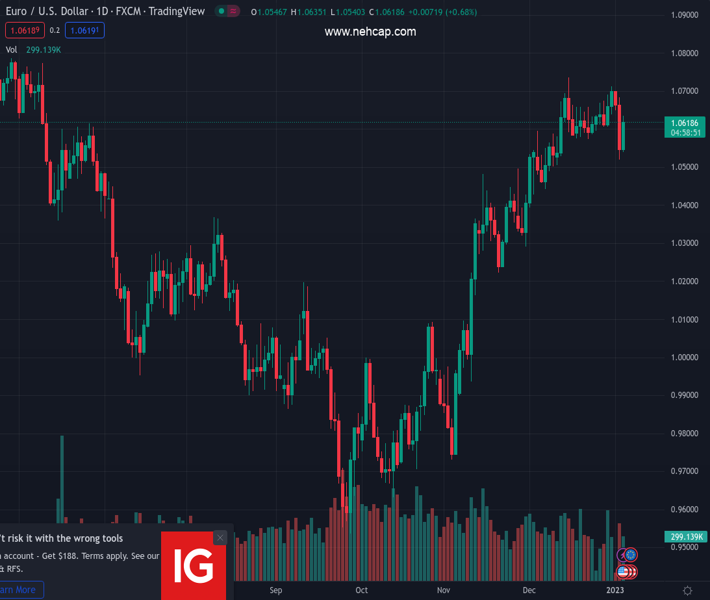
- EUR/USD Price Analysis: Seesawing at around the 20-day EMA and the 1.0600 mark.
The pair currently trades last at 1.06163.
The previous day high was 1.0684 while the previous day low was 1.052. The daily 38.2% Fib levels comes at 1.0582, expected to provide support. Similarly, the daily 61.8% fib level is at 1.0621, expected to provide resistance.
The Euro (EUR) retraces against the US Dollar (USD) after hitting daily highs of 1.0635 and is dropping after the release of mixed US economic data, slightly boosted the US Dollar and shifting sentiment sour. At the time of writing, the EUR/USD is trading at 1.0616, above its opening price by 0.66%.
The EUR/USD fell below 1.0600 after the release of US economic data. November’s JOLTs report showed that the labor market remains tight, coming at 10.458M vs. 10.0M estimates, while October’s upward revision to 10.512M vs. 10.334M cemented the Federal Reserve’s (Fed) case for a 50 bps rate hike on February 1.
At the same time, the Institute for Supply Management (ISM) revealed the Manufacturing PMI index for December, which fell to 48.4, more than the 48.5 estimated by street analysts. Timothy R. Fiore, Chair of the ISM, noted, “The US manufacturing sector again contracted, with the Manufacturing PMI® at its lowest level since the coronavirus pandemic recovery began. With Business Survey Committee panelists reporting softening new order rates over the previous seven months, the December composite index reading reflects companies’ slowing their output.”
Delving into the sub-components of the report, the Employment Index rose by 51.4, returning into expansion, showing an improvement in the labor market, though pressuring the Federal Reserve for further action. The Production and Prices indices continued to ease, flashing the consumer’s shift toward services rather than goods.
Meanwhile, the US Dollar Index (DXY), a gauge of the buck’s value against a basket of six currencies, falls 0.41%, down to 104.258.
From a daily chart perspective, the EUR/USD remains neutral biased, seesawing around the 20-day Exponential Moving Average (EMA) at around 1.0583. Since today’s price action has failed to crack Tuesday’s high of 1.0683, the EUR/USD pair remains exposed to selling pressure. However, it should be said that the Relative Strength Index (RSI) bounced nearby the 50 mid-line, while the Rate of Change (RoC) is almost flat.
The EUR/USD key resistance levels are 1.0683, followed by the 1.0700 mark. On the flip side, the EUR/USD first support would be the 1.0600 mark, followed by the 20-day EMA at 1.0584 and the January 3 swing low of 1.0519.
Technical Levels: Supports and Resistances
EURUSD currently trading at 1.0613 at the time of writing. Pair opened at 1.0552 and is trading with a change of 0.58 % .
| Overview | Overview.1 | |
|---|---|---|
| 0 | Today last price | 1.0613 |
| 1 | Today Daily Change | 0.0061 |
| 2 | Today Daily Change % | 0.5800 |
| 3 | Today daily open | 1.0552 |
The pair remains strongly bullish on the daily timeframe. It trades above its 20 SMA @ 1.0608, 50 SMA 1.0375, 100 SMA @ 1.0135 and 200 SMA @ 1.0321.
| Trends | Trends.1 | |
|---|---|---|
| 0 | Daily SMA20 | 1.0608 |
| 1 | Daily SMA50 | 1.0375 |
| 2 | Daily SMA100 | 1.0135 |
| 3 | Daily SMA200 | 1.0321 |
The previous day high was 1.0684 while the previous day low was 1.052. The daily 38.2% Fib levels comes at 1.0582, expected to provide support. Similarly, the daily 61.8% fib level is at 1.0621, expected to provide resistance.
Note the levels of interest below:
- Pivot support is noted at 1.0486, 1.0421, 1.0322
- Pivot resistance is noted at 1.065, 1.0749, 1.0814
| Levels | Levels.1 |
|---|---|
| Previous Daily High | 1.0684 |
| Previous Daily Low | 1.0520 |
| Previous Weekly High | 1.0713 |
| Previous Weekly Low | 1.0607 |
| Previous Monthly High | 1.0736 |
| Previous Monthly Low | 1.0393 |
| Daily Fibonacci 38.2% | 1.0582 |
| Daily Fibonacci 61.8% | 1.0621 |
| Daily Pivot Point S1 | 1.0486 |
| Daily Pivot Point S2 | 1.0421 |
| Daily Pivot Point S3 | 1.0322 |
| Daily Pivot Point R1 | 1.0650 |
| Daily Pivot Point R2 | 1.0749 |
| Daily Pivot Point R3 | 1.0814 |
[/s2If]
Join Our Telegram Group
")


