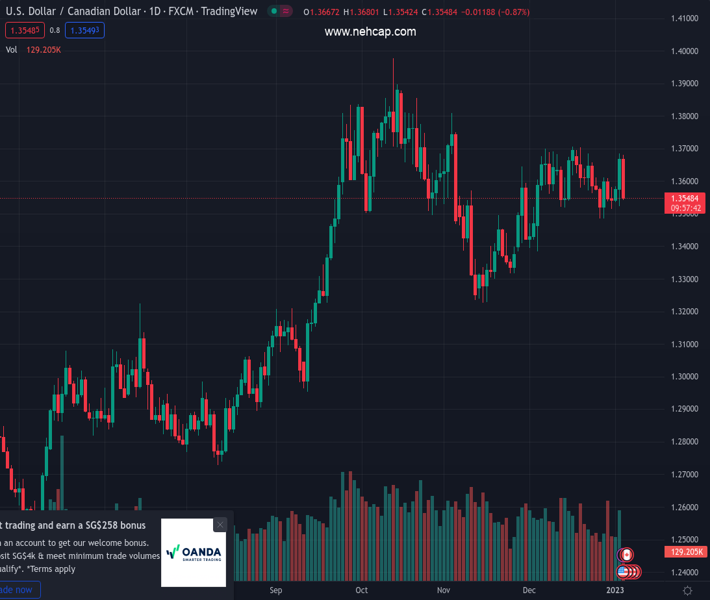
#USDCAD @ 1.35487 is already down more than 100 pips on Wednesday. (Pivot Orderbook analysis)
…
This is a premium post.
[s2If !current_user_can(access_s2member_level4)]Please register for PREMIUM VERSION HERE to read full post below containing analysis. In case of any error or you think you are not able to read the full post below, please email us at support#nehcap.com [lwa][/s2If] [s2If current_user_can(access_s2member_level4)]
- USD/CAD is already down more than 100 pips on Wednesday.
- The US Dollar Index stays deep in negative territory ahead of key US data.
- Falling crude oil prices don’t seem to be impacting CAD’s performance for the time being.
The pair currently trades last at 1.35487.
The previous day high was 1.3685 while the previous day low was 1.3523. The daily 38.2% Fib levels comes at 1.3623, expected to provide resistance. Similarly, the daily 61.8% fib level is at 1.3585, expected to provide resistance.
USD/CAD came under heavy bearish pressure on Wednesday and dropped to a fresh daily low of 1.3542 during the European trading hours. As of writing, the pair was down 0.85% on the day at 1.3555.
The broad-based US Dollar weakness on Wednesday forces USD/CAD to stay on the back foot. Following Tuesday’s rally, the US Dollar Index is down more than 0.5% on a daily basis near 104.00. Improving risk mood, as reflected by the 0.5% gain in the S&P Futures, seems to be hurting the safe-haven US Dollar as investors await key macroeconomic data releases.
The ISM will publish the December Manufacturing PMI report. In addition to the headline PMI reading, investors will also pay close attention to the inflation component, the Prices Paid Index. Later in the day, the FOMC will release the minutes of the December policy meeting.
US Dec ISM Manufacturing PMI Preview: Encouraging sub-indices could temporarily boost US Dollar.
Meanwhile, crude oil prices are down sharply for the second straight day on Wednesday. After having lost nearly 4% on Tuesday, the barrel of West Texas Intermediate is already down nearly 3% on the day, trading slightly below $75. For the time being, however, the US Dollar’s market valuation continues to drive the pair’s action as the commodity-related Canadian Dollar doesn’t seem to be paying attention to oil prices.
Technical Levels: Supports and Resistances
USDCAD currently trading at 1.3553 at the time of writing. Pair opened at 1.367 and is trading with a change of -0.86 % .
| Overview | Overview.1 | |
|---|---|---|
| 0 | Today last price | 1.3553 |
| 1 | Today Daily Change | -0.0117 |
| 2 | Today Daily Change % | -0.8600 |
| 3 | Today daily open | 1.3670 |
The pair is trading below its 20 Daily moving average @ 1.3607, above its 50 Daily moving average @ 1.3526 , above its 100 Daily moving average @ 1.3459 and above its 200 Daily moving average @ 1.3133
| Trends | Trends.1 | |
|---|---|---|
| 0 | Daily SMA20 | 1.3607 |
| 1 | Daily SMA50 | 1.3526 |
| 2 | Daily SMA100 | 1.3459 |
| 3 | Daily SMA200 | 1.3133 |
The previous day high was 1.3685 while the previous day low was 1.3523. The daily 38.2% Fib levels comes at 1.3623, expected to provide resistance. Similarly, the daily 61.8% fib level is at 1.3585, expected to provide resistance.
Note the levels of interest below:
- Pivot support is noted at 1.3566, 1.3463, 1.3404
- Pivot resistance is noted at 1.3729, 1.3788, 1.3891
| Levels | Levels.1 |
|---|---|
| Previous Daily High | 1.3685 |
| Previous Daily Low | 1.3523 |
| Previous Weekly High | 1.3612 |
| Previous Weekly Low | 1.3484 |
| Previous Monthly High | 1.3705 |
| Previous Monthly Low | 1.3385 |
| Daily Fibonacci 38.2% | 1.3623 |
| Daily Fibonacci 61.8% | 1.3585 |
| Daily Pivot Point S1 | 1.3566 |
| Daily Pivot Point S2 | 1.3463 |
| Daily Pivot Point S3 | 1.3404 |
| Daily Pivot Point R1 | 1.3729 |
| Daily Pivot Point R2 | 1.3788 |
| Daily Pivot Point R3 | 1.3891 |
[/s2If]
Join Our Telegram Group
")


