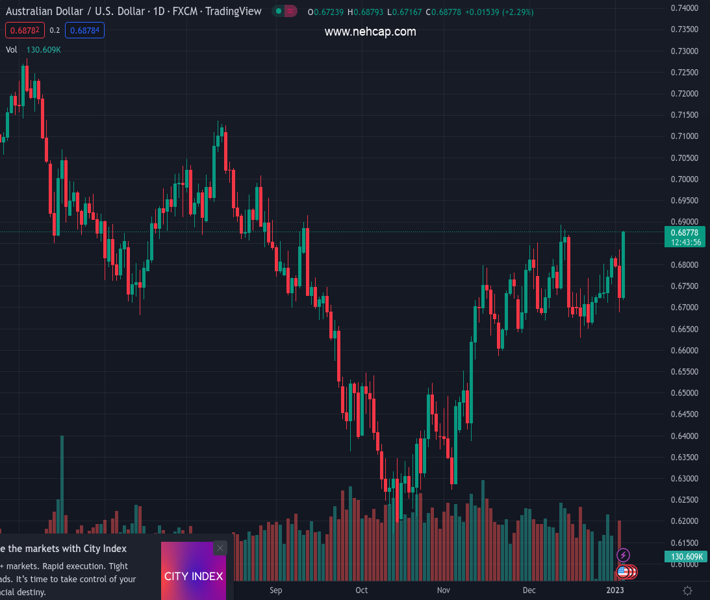
#AUDUSD @ 0.68756 is rallying hard, eyeing 0.6900 amid USD sell-off, upbeat mood. (Pivot Orderbook analysis)
…
This is a premium post.
[s2If !current_user_can(access_s2member_level4)]Please register for PREMIUM VERSION HERE to read full post below containing analysis. In case of any error or you think you are not able to read the full post below, please email us at support#nehcap.com [lwa][/s2If] [s2If current_user_can(access_s2member_level4)]
- AUD/USD is rallying hard, eyeing 0.6900 amid USD sell-off, upbeat mood.
- China is considering a partial end to the Australian coal ban.
- US ISM PMI and Fed Minutes to offer fresh cues to the Aussie.
The pair currently trades last at 0.68756.
The previous day high was 0.6834 while the previous day low was 0.6688. The daily 38.2% Fib levels comes at 0.6744, expected to provide support. Similarly, the daily 61.8% fib level is at 0.6778, expected to provide support.
AUD/USD is riding the risk-on wave higher so far this Wednesday, extending the rebound by over 2% amid a broad sell-off in the US Dollar and the renewed China-Australia trade optimism.
The Aussie caught this relentless bid only after several media reported that China is considering a partial end to its ban on imports of Australian coal. The positive sentiment in the European markets only added to the upsurge in the higher-yielding Aussie Dollar at the expense of the safe-haven US Dollar.
Traders also take advantage of encouraging Reserve Bank of Australia (RBA) thinking, cited by MNI. The report said, “the Reserve Bank of Australia (RBA) believes that “accumulated savings, a tight jobs market and spending cuts will make higher interest rates manageable for most homeowners.”
Next of relevance for the AUD/USD pair remains the US ISM Manufacturing PMI release and the Fed December meeting, which could have a significant impact on US Dollar valuations, eventually influencing the currency pair.
Technical Levels: Supports and Resistances
AUDUSD currently trading at 0.6872 at the time of writing. Pair opened at 0.6729 and is trading with a change of 2.11 % .
| Overview | Overview.1 | |
|---|---|---|
| 0 | Today last price | 0.6872 |
| 1 | Today Daily Change | 0.0142 |
| 2 | Today Daily Change % | 2.1100 |
| 3 | Today daily open | 0.6729 |
The pair remains strongly bullish on the daily timeframe. It trades above its 20 SMA @ 0.6746, 50 SMA 0.6662, 100 SMA @ 0.6637 and 200 SMA @ 0.6856.
| Trends | Trends.1 | |
|---|---|---|
| 0 | Daily SMA20 | 0.6746 |
| 1 | Daily SMA50 | 0.6662 |
| 2 | Daily SMA100 | 0.6637 |
| 3 | Daily SMA200 | 0.6856 |
The previous day high was 0.6834 while the previous day low was 0.6688. The daily 38.2% Fib levels comes at 0.6744, expected to provide support. Similarly, the daily 61.8% fib level is at 0.6778, expected to provide support.
Note the levels of interest below:
- Pivot support is noted at 0.6666, 0.6604, 0.652
- Pivot resistance is noted at 0.6813, 0.6897, 0.6959
| Levels | Levels.1 |
|---|---|
| Previous Daily High | 0.6834 |
| Previous Daily Low | 0.6688 |
| Previous Weekly High | 0.6821 |
| Previous Weekly Low | 0.6710 |
| Previous Monthly High | 0.6893 |
| Previous Monthly Low | 0.6629 |
| Daily Fibonacci 38.2% | 0.6744 |
| Daily Fibonacci 61.8% | 0.6778 |
| Daily Pivot Point S1 | 0.6666 |
| Daily Pivot Point S2 | 0.6604 |
| Daily Pivot Point S3 | 0.6520 |
| Daily Pivot Point R1 | 0.6813 |
| Daily Pivot Point R2 | 0.6897 |
| Daily Pivot Point R3 | 0.6959 |
[/s2If]
Join Our Telegram Group
")


