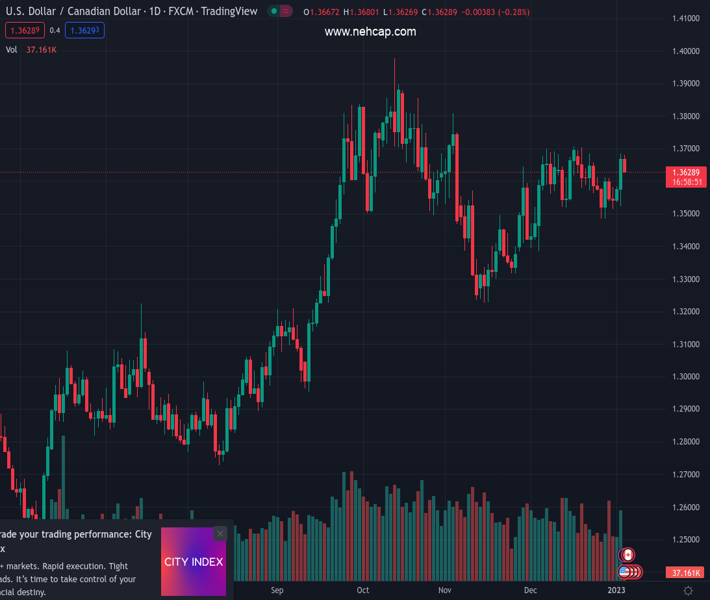
#USDCAD @ 1.36299 The risk-off market mood in global markets has strengthened the US Dollar, (Pivot Orderbook analysis)
…
This is a premium post.
[s2If !current_user_can(access_s2member_level4)]Please register for PREMIUM VERSION HERE to read full post below containing analysis. In case of any error or you think you are not able to read the full post below, please email us at support#nehcap.com [lwa][/s2If] [s2If current_user_can(access_s2member_level4)]
- The risk-off market mood in global markets has strengthened the US Dollar,
- A bull cross, represented by the 20-and 50-EMAs at 1.3578, indicates more upside ahead.
- The RSI (14) has jumped into the bullish range of 60.00-80.00, which supports the Greenback.
The pair currently trades last at 1.36299.
The previous day high was 1.3685 while the previous day low was 1.3523. The daily 38.2% Fib levels comes at 1.3623, expected to provide support. Similarly, the daily 61.8% fib level is at 1.3585, expected to provide support.
The USD/CAD pair has dropped to near 1.3636 in the Asian session after multiple failed attempts of breaking above the critical resistance of 1.3680. The US Dollar Index is delivering a subdued performance as investors are restricting themselves from making potential positions before the release of the United States ISM Manufacturing PMI data.
Meanwhile, S&P500 futures are attempting to recover after a two-day sell-off, however, the resilience in recovery is still missing, which indicates that the risk profile is still negative.
Investors should note that the trend has turned bullish on a four-hour scale after remaining topsy-turvy for a long period. The Loonie asset is likely to face barricades around the horizontal resistance plotted near the round-level hurdle of 1.3700.
A bull cross, represented by the 20-and 50-period Exponential Moving Averages (EMAs) at 1.3578, indicates more upside ahead.
Meanwhile, the Relative Strength Index (RSI) (14) has jumped into the bullish range of 60.00-80.00, which indicates more upside ahead.
A decisive break above the December 16 high around 1.3700 will strengthen the US Dollar and will drive the Loonie asset toward October 25 high at 1.3748 and November 3 high at 1.3808.
On the contrary, the major could drop to November 23 high at 1.3440 after surrendering the psychological support of 1.3500. Later on, a slippage below 1.3440 will expose the Loonie asset for more downside towards December 5 low at 1.3385.
Technical Levels: Supports and Resistances
USDCAD currently trading at 1.3637 at the time of writing. Pair opened at 1.367 and is trading with a change of -0.24 % .
| Overview | Overview.1 | |
|---|---|---|
| 0 | Today last price | 1.3637 |
| 1 | Today Daily Change | -0.0033 |
| 2 | Today Daily Change % | -0.2400 |
| 3 | Today daily open | 1.3670 |
The pair remains strongly bullish on the daily timeframe. It trades above its 20 SMA @ 1.3607, 50 SMA 1.3526, 100 SMA @ 1.3459 and 200 SMA @ 1.3133.
| Trends | Trends.1 | |
|---|---|---|
| 0 | Daily SMA20 | 1.3607 |
| 1 | Daily SMA50 | 1.3526 |
| 2 | Daily SMA100 | 1.3459 |
| 3 | Daily SMA200 | 1.3133 |
The previous day high was 1.3685 while the previous day low was 1.3523. The daily 38.2% Fib levels comes at 1.3623, expected to provide support. Similarly, the daily 61.8% fib level is at 1.3585, expected to provide support.
Note the levels of interest below:
- Pivot support is noted at 1.3566, 1.3463, 1.3404
- Pivot resistance is noted at 1.3729, 1.3788, 1.3891
| Levels | Levels.1 |
|---|---|
| Previous Daily High | 1.3685 |
| Previous Daily Low | 1.3523 |
| Previous Weekly High | 1.3612 |
| Previous Weekly Low | 1.3484 |
| Previous Monthly High | 1.3705 |
| Previous Monthly Low | 1.3385 |
| Daily Fibonacci 38.2% | 1.3623 |
| Daily Fibonacci 61.8% | 1.3585 |
| Daily Pivot Point S1 | 1.3566 |
| Daily Pivot Point S2 | 1.3463 |
| Daily Pivot Point S3 | 1.3404 |
| Daily Pivot Point R1 | 1.3729 |
| Daily Pivot Point R2 | 1.3788 |
| Daily Pivot Point R3 | 1.3891 |
[/s2If]
Join Our Telegram Group
")


