Asian stocks are having immense pressure following the footprints of S&P500. (Pivot Orderbook analysis)
…
This is a premium post.
[s2If !current_user_can(access_s2member_level4)]Please register for PREMIUM VERSION HERE to read full post below containing analysis. In case of any error or you think you are not able to read the full post below, please email us at support#nehcap.com [lwa][/s2If] [s2If current_user_can(access_s2member_level4)]
- Asian stocks are having immense pressure following the footprints of S&P500.
- Japanese equities have been dumped significantly on Tuesday due to stretched weekend-inspired volatility.
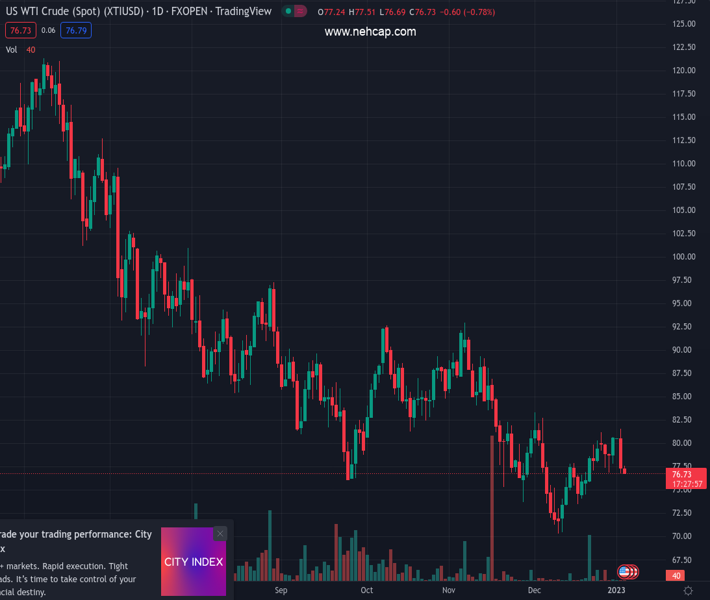
- The oil price has extended its downside below $77.00 as global recession fears soar.
The pair currently trades last at 25832.6.
The previous day high was 25994.4 while the previous day low was 25549.18. The daily 38.2% Fib levels comes at 25824.33, expected to provide support. Similarly, the daily 61.8% fib level is at 25719.25, expected to provide support.
Markets in the Asian domain are following the cautious mood adopted by the S&P500 on Tuesday as investors seek the release of the Federal Open Market Committee (FOMC) minutes for fresh impetus. Investors seem more worried about the cues that will portray policy projections for CY2023. Also, expectations of delayed recovery in China despite the sheer pace of reopening of the economy have triggered a risk aversion theme.
At the press time, Japan’s Nikkei225 plunged 1.30%, ChinaA50 added 0.3%, Hang Seng soared 2.40% while Nifty50 remained flat.
Japanese stocks are facing immense heat on Wednesday after a stretched weekend. Nikkei225 is sensing immense selling pressure despite the Bank of Japan (BOJ) Governor Haruhiko Kuroda having promised more policy easing to accelerate wage growth and inflation to meet the inflation targets raised recently by the central bank.
Meanwhile, Chinese equities have attempted a recovery, however, the sentiment is still risk-averse. Chinese administration has executed reopening measures at a sheer pace while the plan has resulted in a spike in the number of Covid-19 cases. As the economy is set on the track of reopening, it is highly likely that firmer demand from corporate would accelerate inflation. Analysts at Danske Bank stated that “A Chinese recovery will have a positive spill-over to the global economy but also be an inflationary force through its effect on commodity prices.
On the oil front, oil prices have surrendered the immediate support of $77.00. Investors dumped the black gold on Tuesday as investors see more interest rate hikes by the Federal Reserve (Fed) to tame the stubborn inflation. Investors are keenly waiting for the release of FOMC minutes, which will provide sufficient information on the policy outlook.
Negative commentary on economic projections by the International Monetary Fund (IMF) has also triggered the risk of recession, which is a negative trigger for the oil demand. Managing Director Kristalina Georgieva of the IMF cited on the CBS Sunday morning news program that “For much of the global economy, 2023 is going to be a tough year as the main engines of global growth – the United States, Europe, and China – all may experience weakening activity,”.
Technical Levels: Supports and Resistances
XTIUSD currently trading at 25832.6 at the time of writing. Pair opened at 25832.6 and is trading with a change of 0.0 % .
| Overview | Overview.1 | |
|---|---|---|
| 0 | Today last price | 25832.6 |
| 1 | Today Daily Change | 0.0 |
| 2 | Today Daily Change % | 0.0 |
| 3 | Today daily open | 25832.6 |
The pair remains strongly bearish on the daily time frame. It trades below the 20 SMA @ 26873.25, 50 SMA 27457.54, 100 SMA @ 27478.65 and 200 SMA @ 27284.62.
| Trends | Trends.1 | |
|---|---|---|
| 0 | Daily SMA20 | 26873.25 |
| 1 | Daily SMA50 | 27457.54 |
| 2 | Daily SMA100 | 27478.65 |
| 3 | Daily SMA200 | 27284.62 |
The previous day high was 25994.4 while the previous day low was 25549.18. The daily 38.2% Fib levels comes at 25824.33, expected to provide support. Similarly, the daily 61.8% fib level is at 25719.25, expected to provide support.
Note the levels of interest below:
- Pivot support is noted at 25589.72, 25346.84, 25144.5
- Pivot resistance is noted at 26034.94, 26237.28, 26480.16
| Levels | Levels.1 |
|---|---|
| Previous Daily High | 25994.40 |
| Previous Daily Low | 25549.18 |
| Previous Weekly High | 26479.57 |
| Previous Weekly Low | 25793.22 |
| Previous Monthly High | 28325.89 |
| Previous Monthly Low | 25793.22 |
| Daily Fibonacci 38.2% | 25824.33 |
| Daily Fibonacci 61.8% | 25719.25 |
| Daily Pivot Point S1 | 25589.72 |
| Daily Pivot Point S2 | 25346.84 |
| Daily Pivot Point S3 | 25144.50 |
| Daily Pivot Point R1 | 26034.94 |
| Daily Pivot Point R2 | 26237.28 |
| Daily Pivot Point R3 | 26480.16 |
[/s2If]
Join Our Telegram Group
")


