Oil price is likely to display more downside below $77.00 ahead of FOMC minutes. (Pivot Orderbook analysis)
…
This is a premium post.
[s2If !current_user_can(access_s2member_level4)]Please register for PREMIUM VERSION HERE to read full post below containing analysis. In case of any error or you think you are not able to read the full post below, please email us at support#nehcap.com [lwa][/s2If] [s2If current_user_can(access_s2member_level4)]
- Oil price is likely to display more downside below $77.00 ahead of FOMC minutes.
- A delay in economic recovery in China due to the Covid situation is impacting the oil price.
- Sheer recovery in Chinese economic prospects after reopening could propel inflationary pressures.
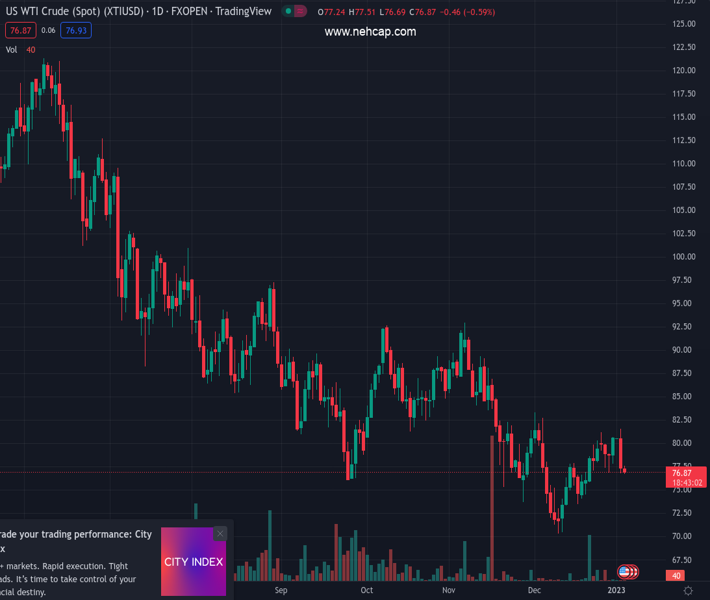
The pair currently trades last at 77.0.
The previous day high was 81.56 while the previous day low was 76.75. The daily 38.2% Fib levels comes at 78.59, expected to provide resistance. Similarly, the daily 61.8% fib level is at 79.72, expected to provide resistance.
West Texas Intermediate (WTI), futures on NYMEX, have witnessed a perpendicular downside journey after testing the previous week’s high around $81.00 with weak buying interest. The oil price has plunged dramatically to near $77.00 and is likely to display more weakness as investors are worried about delayed economic recovery in China.
The street is expecting a slow recovery in economic activities in China after a spike in Covid-19 cases led by the sheer pace adopted for reopening measures by the Chinese administration. The Covid situation is getting vulnerable each day as the handling of infected patients is getting beyond the control of medical authorities.
History says that the reopening of an economy leads to pent-up demand for commodities, which results in a sheer acceleration in the inflationary pressures. Analysts at Danske Bank are of the view that “A Chinese recovery will have a positive spill-over to the global economy but also be an inflationary force through its effect on commodity prices,”
Meanwhile, better-than-projected Caixin Manufacturing PMI data failed to support the oil price. The IHS Markit reported the economic data at 49.0, higher than the consensus of 48.8 but lower than the prior release of 49.4.
The US Dollar Index (DXY) is managing to sustain above the critical support of 104.00. The oil price is likely to remain on the tenterhooks till the release of the Federal Open Market Committee (FOMC) minutes. Although a majority of inflation indicators are confirming softer demand and signs that inflation has topped, the labor market is extremely tight and the inflation rate is still far from the 2% target. The release of the FOMC minutes will indicate the policy outlook for CY2023.
The expression of more policy tightening by the Federal Reserve (Fed) could trigger the risk of recession, which is vulnerable to oil demand and could impact oil prices significantly.
Technical Levels: Supports and Resistances
XTIUSD currently trading at 77.0 at the time of writing. Pair opened at 77.33 and is trading with a change of -0.43 % .
| Overview | Overview.1 | |
|---|---|---|
| 0 | Today last price | 77.00 |
| 1 | Today Daily Change | -0.33 |
| 2 | Today Daily Change % | -0.43 |
| 3 | Today daily open | 77.33 |
The pair is trading above its 20 Daily moving average @ 76.8, below its 50 Daily moving average @ 80.8 , below its 100 Daily moving average @ 83.55 and below its 200 Daily moving average @ 93.46
| Trends | Trends.1 | |
|---|---|---|
| 0 | Daily SMA20 | 76.80 |
| 1 | Daily SMA50 | 80.80 |
| 2 | Daily SMA100 | 83.55 |
| 3 | Daily SMA200 | 93.46 |
The previous day high was 81.56 while the previous day low was 76.75. The daily 38.2% Fib levels comes at 78.59, expected to provide resistance. Similarly, the daily 61.8% fib level is at 79.72, expected to provide resistance.
Note the levels of interest below:
- Pivot support is noted at 75.54, 73.74, 70.73
- Pivot resistance is noted at 80.35, 83.36, 85.16
| Levels | Levels.1 |
|---|---|
| Previous Daily High | 81.56 |
| Previous Daily Low | 76.75 |
| Previous Weekly High | 81.19 |
| Previous Weekly Low | 76.86 |
| Previous Monthly High | 83.30 |
| Previous Monthly Low | 70.27 |
| Daily Fibonacci 38.2% | 78.59 |
| Daily Fibonacci 61.8% | 79.72 |
| Daily Pivot Point S1 | 75.54 |
| Daily Pivot Point S2 | 73.74 |
| Daily Pivot Point S3 | 70.73 |
| Daily Pivot Point R1 | 80.35 |
| Daily Pivot Point R2 | 83.36 |
| Daily Pivot Point R3 | 85.16 |
[/s2If]
Join Our Telegram Group
")


