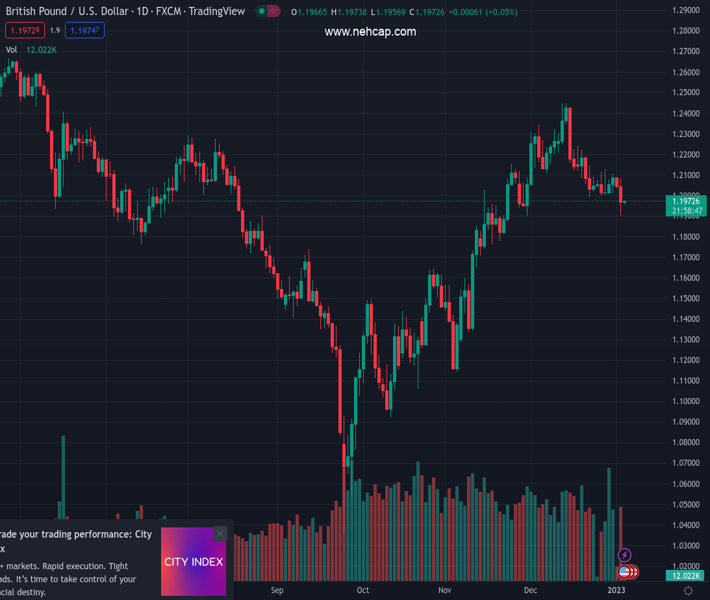
#GBPUSD @ 1.19683 is continuously trading below 1.2000 amid caution in risk profile ahead of US Manufacturing data. (Pivot Orderbook analysis)
…
This is a premium post.
[s2If !current_user_can(access_s2member_level4)]Please register for PREMIUM VERSION HERE to read full post below containing analysis. In case of any error or you think you are not able to read the full post below, please email us at support#nehcap.com [lwa][/s2If] [s2If current_user_can(access_s2member_level4)]
- GBP/USD is continuously trading below 1.2000 amid caution in risk profile ahead of US Manufacturing data.
- The USD Index climbed to near two-week high around 104.40 after a solid recovery from 103.00.
- UK’s corporate debt has declined sharply amid aggressive policy tightening by the BoE.
The pair currently trades last at 1.19683.
The previous day high was 1.2102 while the previous day low was 1.2034. The daily 38.2% Fib levels comes at 1.206, expected to provide resistance. Similarly, the daily 61.8% fib level is at 1.2076, expected to provide resistance.
The GBP/USD pair has shifted its business below the psychological support of 1.2000 in the early Asian session. The Cable has failed in taking control above 1.2000 amid a risk-off market mood. A significant drop in investors’ risk appetite ahead of the United States ISM Manufacturing PMI data and the Federal Reserve (Fed)’s minutes for December monetary policy has strengthened the US Dollar.
S&P500 continued its downside journey on Tuesday, portraying that the risk-aversion theme has been underpinned by the market participants. The US Dollar Index (DXY) climbed to near two-week high of around 104.40 after a solid recovery from 103.00.
Investors are worried that the Federal Reserve (Fed) might need to resort to more policy tightening to contain the stubborn inflation. A note from Bill Dudley, an analyst at Bloomberg, cited three focus areas for the Fed in CY2023. The first one is the tight labor market and lower Unemployment Rate that is propelling wage inflation. Second is underinvestment in the oil and gas sector as Russia could weaponize its hold on major oil supply, which could trigger inflation further. And, the third one is the budget deficit performance which is likely to be around 5% of the Gross Domestic Product (GDP) in 2023.
Meanwhile, investors are awaiting the release of the US ISM Manufacturing PMI for further cues, which is seen lower at 48.5 vs. the former release of 49.0. While the New Orders Index data is seen higher at 48.1 against 47.2 in the prior release.
On the United Kingdom front, falling appetite for corporate debt is raising red flags for economic prospects. According to a quarterly Deloitte CFP survey, 70% of UK CFOs have termed credit as ‘costly’ amid the most aggressive tightening policy by the Bank of England (BoE) in more than 30 years, as reported by Reuters. Meanwhile, the UK administration has removed the requirement of compulsory Covid tests for arrivals from China.
Technical Levels: Supports and Resistances
GBPUSD currently trading at 1.1961 at the time of writing. Pair opened at 1.2049 and is trading with a change of -0.73 % .
| Overview | Overview.1 | |
|---|---|---|
| 0 | Today last price | 1.1961 |
| 1 | Today Daily Change | -0.0088 |
| 2 | Today Daily Change % | -0.7300 |
| 3 | Today daily open | 1.2049 |
The pair is trading below its 20 Daily moving average @ 1.2151, above its 50 Daily moving average @ 1.1922 , above its 100 Daily moving average @ 1.1667 and below its 200 Daily moving average @ 1.2041
| Trends | Trends.1 | |
|---|---|---|
| 0 | Daily SMA20 | 1.2151 |
| 1 | Daily SMA50 | 1.1922 |
| 2 | Daily SMA100 | 1.1667 |
| 3 | Daily SMA200 | 1.2041 |
The previous day high was 1.2102 while the previous day low was 1.2034. The daily 38.2% Fib levels comes at 1.206, expected to provide resistance. Similarly, the daily 61.8% fib level is at 1.2076, expected to provide resistance.
Note the levels of interest below:
- Pivot support is noted at 1.2021, 1.1994, 1.1954
- Pivot resistance is noted at 1.2089, 1.2129, 1.2156
| Levels | Levels.1 |
|---|---|
| Previous Daily High | 1.2102 |
| Previous Daily Low | 1.2034 |
| Previous Weekly High | 1.2126 |
| Previous Weekly Low | 1.2002 |
| Previous Monthly High | 1.2447 |
| Previous Monthly Low | 1.1992 |
| Daily Fibonacci 38.2% | 1.2060 |
| Daily Fibonacci 61.8% | 1.2076 |
| Daily Pivot Point S1 | 1.2021 |
| Daily Pivot Point S2 | 1.1994 |
| Daily Pivot Point S3 | 1.1954 |
| Daily Pivot Point R1 | 1.2089 |
| Daily Pivot Point R2 | 1.2129 |
| Daily Pivot Point R3 | 1.2156 |
[/s2If]
Join Our Telegram Group
")


