#USDJPY @ 131.013 The reached a six-month low at 129.50 but recovered some ground, albeit US Treasury yields fell. (Pivot Orderbook analysis)
…
This is a premium post.
[s2If !current_user_can(access_s2member_level4)]Please register for PREMIUM VERSION HERE to read full post below containing analysis. In case of any error or you think you are not able to read the full post below, please email us at support#nehcap.com [lwa][/s2If] [s2If current_user_can(access_s2member_level4)]
- The USD/JPY reached a six-month low at 129.50 but recovered some ground, albeit US Treasury yields fell.
- USD/JPY Price Analysis: Downward biased, but short term might test the 20-day EMA around 133.76.
The pair currently trades last at 131.013.
The previous day high was 131.13 while the previous day low was 130.62. The daily 38.2% Fib levels comes at 130.82, expected to provide support. Similarly, the daily 61.8% fib level is at 130.94, expected to provide support.
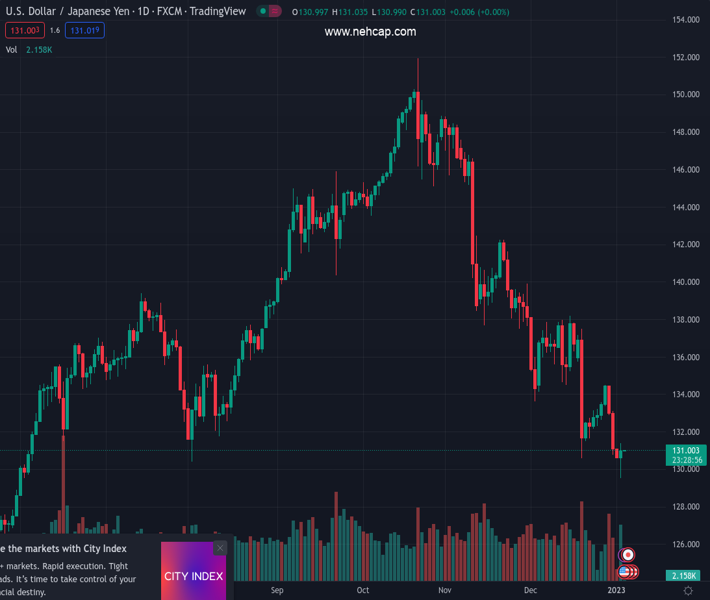
The USD/JPY climbs sharply after dropping to eight-month low levels, last seen in June 2021 around 129.50, at around 130.90s, as the US Dollar (USD) emerges as the strongest currency in Tuesday trading. Therefore, the USD/JPY is trading at 131.01, above its opening price by 0.25%.
On Tuesday, the USD/JPY daily chart portrays the pair as downward biased. However, Tuesday’s price action formed a hammer preceded by a downtrend, suggesting that buyers outpaced sellers, suggesting that the USD/JPY might print a leg-up before continuing its downtrend. The bias would remain intact as long as the USD/JPY stays below the 20-day Exponential Moving Average (EMA) at 133.76. Otherwise, it would pave the way for a test of the 200-day EMA at 134.83, which, once cleared, could send the USD/JPY rallying to the 50-day EMA at 137.04
Oscillators like the Relative Strength Index (RSI) remain in bearish territory, while the Rate of Change (RoC) displays selling pressure waning.
Therefore, the USD/JPY first resistance would be the 132.00 mark. A breach of the latter would expose the December 30 daily high of 133.09, followed by the 20-day EMA at 133.76..
Technical Levels: Supports and Resistances
USDJPY currently trading at 131.04 at the time of writing. Pair opened at 130.72 and is trading with a change of 0.24 % .
| Overview | Overview.1 | |
|---|---|---|
| 0 | Today last price | 131.04 |
| 1 | Today Daily Change | 0.32 |
| 2 | Today Daily Change % | 0.24 |
| 3 | Today daily open | 130.72 |
The pair remains strongly bearish on the daily time frame. It trades below the 20 SMA @ 134.6, 50 SMA 139.2, 100 SMA @ 141.08 and 200 SMA @ 136.26.
| Trends | Trends.1 | |
|---|---|---|
| 0 | Daily SMA20 | 134.60 |
| 1 | Daily SMA50 | 139.20 |
| 2 | Daily SMA100 | 141.08 |
| 3 | Daily SMA200 | 136.26 |
The previous day high was 131.13 while the previous day low was 130.62. The daily 38.2% Fib levels comes at 130.82, expected to provide support. Similarly, the daily 61.8% fib level is at 130.94, expected to provide support.
Note the levels of interest below:
- Pivot support is noted at 130.52, 130.31, 130.0
- Pivot resistance is noted at 131.03, 131.34, 131.55
| Levels | Levels.1 |
|---|---|
| Previous Daily High | 131.13 |
| Previous Daily Low | 130.62 |
| Previous Weekly High | 134.50 |
| Previous Weekly Low | 130.78 |
| Previous Monthly High | 138.18 |
| Previous Monthly Low | 130.57 |
| Daily Fibonacci 38.2% | 130.82 |
| Daily Fibonacci 61.8% | 130.94 |
| Daily Pivot Point S1 | 130.52 |
| Daily Pivot Point S2 | 130.31 |
| Daily Pivot Point S3 | 130.00 |
| Daily Pivot Point R1 | 131.03 |
| Daily Pivot Point R2 | 131.34 |
| Daily Pivot Point R3 | 131.55 |
[/s2If]
Join Our Telegram Group
")


