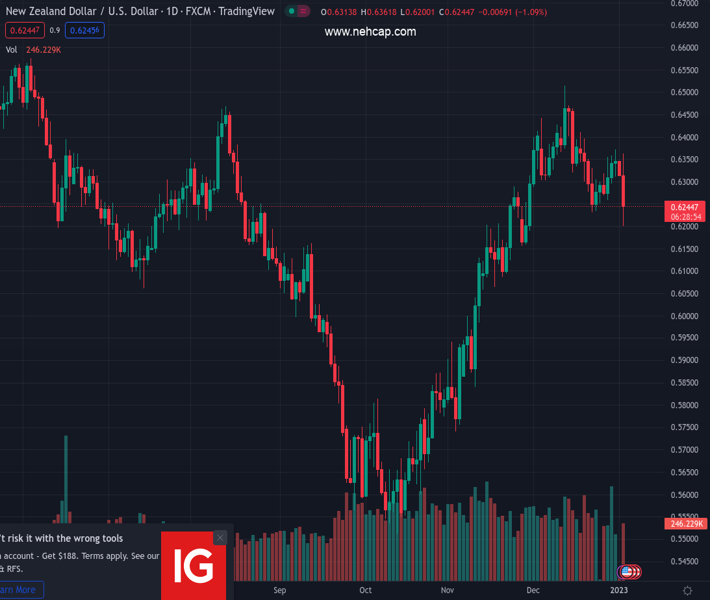
#NZDUSD @ 0.62444 Kiwi trims losses versus US Dollar as DXY retreats. (Pivot Orderbook analysis)
…
This is a premium post.
[s2If !current_user_can(access_s2member_level4)]Please register for PREMIUM VERSION HERE to read full post below containing analysis. In case of any error or you think you are not able to read the full post below, please email us at support#nehcap.com [lwa][/s2If] [s2If current_user_can(access_s2member_level4)]
- Kiwi trims losses versus US Dollar as DXY retreats.
- Wall Street turns negative after first minutes of trading.
- NZD/USD off lows, moving without clear direction.
The pair currently trades last at 0.62444.
The previous day high was 0.6356 while the previous day low was 0.6309. The daily 38.2% Fib levels comes at 0.6327, expected to provide resistance. Similarly, the daily 61.8% fib level is at 0.6338, expected to provide resistance.
The NZD/USD rebounded after hitting the lowest level since late November at 0.6199, climbing to 0.6285. The rebound lost strength as US markets turned negative after the initial half-hour of regular trading on Wall Street.
The Kiwi is still in negative for the day versus the Dollar, down 50 pips. The NZD/USD is attempting to recover 0.6250/60, a key technical level. If it is unable to do, the bearish pressure could return. Support levels are seen at 0.6230 and then 0.6200.
On the contrary, if NZD/USD consolidates above 0.6280, it would set the attention on the next resistance seen around 0.6310.
The greenback lost momentum but so far it has not shown a conviction of a reversal. The decline so far looks like a correction and it could resume the upside, particularly if US equity prices remain in red. The DXY is up by 0.85%, off highs at 104.40. Earlier it reached at 104.85, the highest level since December 20.
Economic data from the US showed the S&P Global Manufacturing Index at 46.2 in December, unchanged from the flash reading. Construction spending rose in November by 0.2% against expectations of a 0.4% slide. On Wednesday, the ISM manufacturing is due and the Federal Reserve will publish the minutes of the latest FOMC meeting.
The GDT Price Index dropped by 2.8% versus market expectations of a 0.6% increase from the latest December auction.
Technical Levels: Supports and Resistances
NZDUSD currently trading at 0.6258 at the time of writing. Pair opened at 0.6326 and is trading with a change of -1.07 % .
| Overview | Overview.1 | |
|---|---|---|
| 0 | Today last price | 0.6258 |
| 1 | Today Daily Change | -0.0068 |
| 2 | Today Daily Change % | -1.0700 |
| 3 | Today daily open | 0.6326 |
The pair is trading below its 20 Daily moving average @ 0.6347, above its 50 Daily moving average @ 0.6173 , above its 100 Daily moving average @ 0.604 and above its 200 Daily moving average @ 0.6238
| Trends | Trends.1 | |
|---|---|---|
| 0 | Daily SMA20 | 0.6347 |
| 1 | Daily SMA50 | 0.6173 |
| 2 | Daily SMA100 | 0.6040 |
| 3 | Daily SMA200 | 0.6238 |
The previous day high was 0.6356 while the previous day low was 0.6309. The daily 38.2% Fib levels comes at 0.6327, expected to provide resistance. Similarly, the daily 61.8% fib level is at 0.6338, expected to provide resistance.
Note the levels of interest below:
- Pivot support is noted at 0.6305, 0.6283, 0.6258
- Pivot resistance is noted at 0.6352, 0.6377, 0.6399
| Levels | Levels.1 |
|---|---|
| Previous Daily High | 0.6356 |
| Previous Daily Low | 0.6309 |
| Previous Weekly High | 0.6373 |
| Previous Weekly Low | 0.6253 |
| Previous Monthly High | 0.6514 |
| Previous Monthly Low | 0.6230 |
| Daily Fibonacci 38.2% | 0.6327 |
| Daily Fibonacci 61.8% | 0.6338 |
| Daily Pivot Point S1 | 0.6305 |
| Daily Pivot Point S2 | 0.6283 |
| Daily Pivot Point S3 | 0.6258 |
| Daily Pivot Point R1 | 0.6352 |
| Daily Pivot Point R2 | 0.6377 |
| Daily Pivot Point R3 | 0.6399 |
[/s2If]
Join Our Telegram Group
")


