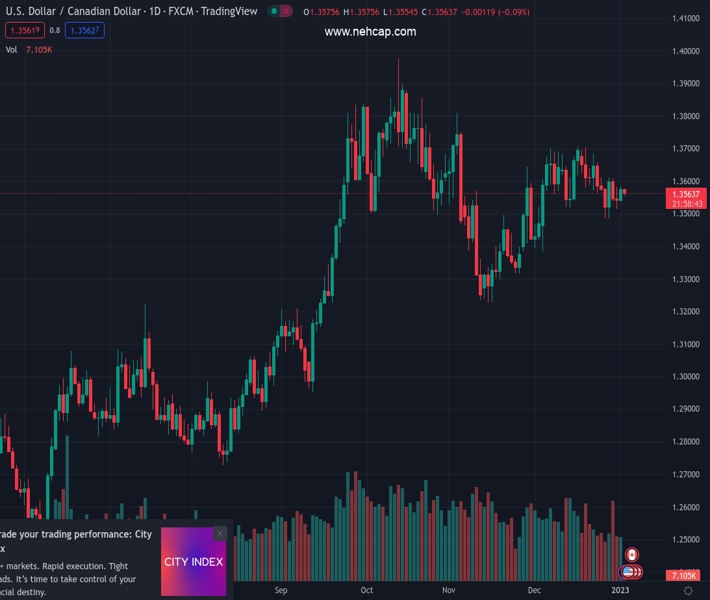
#USDCAD @ 1.35720 has sensed selling pressure after failing to surpass the 1.3580 resistance. (Pivot Orderbook analysis)
…
This is a premium post.
[s2If !current_user_can(access_s2member_level4)]Please register for PREMIUM VERSION HERE to read full post below containing analysis. In case of any error or you think you are not able to read the full post below, please email us at support#nehcap.com [lwa][/s2If] [s2If current_user_can(access_s2member_level4)]
- USD/CAD has sensed selling pressure after failing to surpass the 1.3580 resistance.
- Risk-sensitive currencies are gaining traction as investors are expecting a weak move by the USD Index.
- The release of the FOMC minutes and Canadian employment data will remain in the spotlight.
The pair currently trades last at 1.35720.
The previous day high was 1.3582 while the previous day low was 1.3514. The daily 38.2% Fib levels comes at 1.354, expected to provide support. Similarly, the daily 61.8% fib level is at 1.3556, expected to provide support.
The USD/CAD pair is displaying some volatile moves in the early Tokyo session after failing to overstep the immediate resistance of 1.3580. The Loonie asset is attracting offers led by improving investors’ risk appetite and an expansion in the oil price.
Risk-sensitive currencies are gaining traction as investors are expecting a carry-forward of weak performance by the US Dollar Index ahead. The USD Index witnessed a steep fall on Friday after surrendering the crucial support of 103.50. Meanwhile, S&P500 futures have initiated action on a positive note, which indicates that the risk profile is getting cheerful.
This week, the release of the Federal Open Market Committee (FOMC) will hog the limelight. The FOMC minutes will provide the rationale behind hiking interest rates by 50 basis points (bps) in December’s monetary policy by the Federal Reserve (Fed).
Previewing this week’s upcoming events from the US, TD Securities analysts said that they expect the minutes of the FOMC’s December policy meeting shed additional light on the Fed’s policy outlook for 2023. Analysts at TD securities are of the view that the terminal rate will reach a range of 5.25-5.50% by the May FOMC meeting.
On the Loonie front, investors will focus on the release of the Canadian employment data, which will release on Friday. Analysts at TD Securities said that they expect employment to rise by 8K in December with the labor market starting to cool down. The Unemployment Rate could trim to 5.2% and the wage range could push higher to 5.5% on an annual basis. An increment in wage growth might keep inflation at elevated levels.
Meanwhile, the oil price has pushed higher to near $80.50 as investors see a peak in Covid-19 cases in China, which will put the economy back on track. It is worth noting that Canada is a leading exporter of oil to the United States and higher oil prices support the Canadian Dollar.
Technical Levels: Supports and Resistances
USDCAD currently trading at 1.3557 at the time of writing. Pair opened at 1.354 and is trading with a change of 0.13 % .
| Overview | Overview.1 | |
|---|---|---|
| 0 | Today last price | 1.3557 |
| 1 | Today Daily Change | 0.0017 |
| 2 | Today Daily Change % | 0.1300 |
| 3 | Today daily open | 1.3540 |
The pair is trading below its 20 Daily moving average @ 1.3607, above its 50 Daily moving average @ 1.3527 , above its 100 Daily moving average @ 1.3444 and above its 200 Daily moving average @ 1.3122
| Trends | Trends.1 | |
|---|---|---|
| 0 | Daily SMA20 | 1.3607 |
| 1 | Daily SMA50 | 1.3527 |
| 2 | Daily SMA100 | 1.3444 |
| 3 | Daily SMA200 | 1.3122 |
The previous day high was 1.3582 while the previous day low was 1.3514. The daily 38.2% Fib levels comes at 1.354, expected to provide support. Similarly, the daily 61.8% fib level is at 1.3556, expected to provide support.
Note the levels of interest below:
- Pivot support is noted at 1.3508, 1.3477, 1.344
- Pivot resistance is noted at 1.3576, 1.3613, 1.3644
| Levels | Levels.1 |
|---|---|
| Previous Daily High | 1.3582 |
| Previous Daily Low | 1.3514 |
| Previous Weekly High | 1.3612 |
| Previous Weekly Low | 1.3484 |
| Previous Monthly High | 1.3705 |
| Previous Monthly Low | 1.3385 |
| Daily Fibonacci 38.2% | 1.3540 |
| Daily Fibonacci 61.8% | 1.3556 |
| Daily Pivot Point S1 | 1.3508 |
| Daily Pivot Point S2 | 1.3477 |
| Daily Pivot Point S3 | 1.3440 |
| Daily Pivot Point R1 | 1.3576 |
| Daily Pivot Point R2 | 1.3613 |
| Daily Pivot Point R3 | 1.3644 |
[/s2If]
Join Our Telegram Group
")


