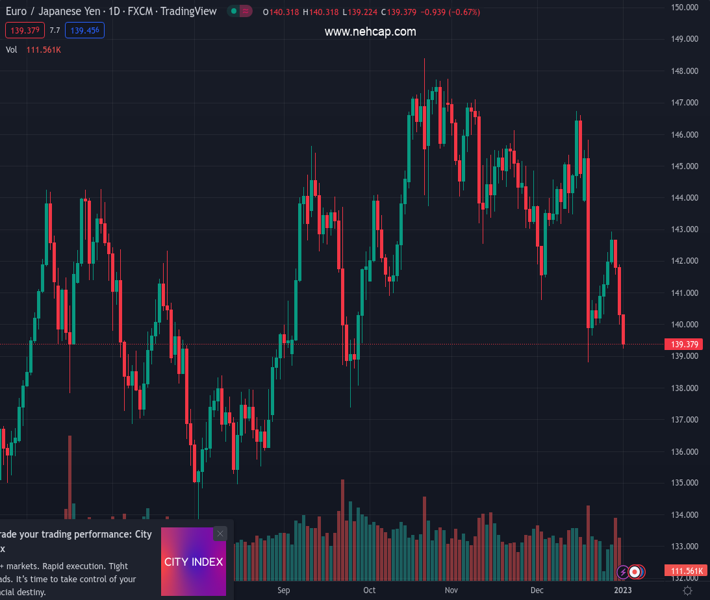
#EURJPY @ 139.450 tumbles beneath the 140.00 figure as the cross dives below the 200-DMA and the 20-day crosses below the 100-DMA. (Pivot Orderbook analysis)
…
This is a premium post.
[s2If !current_user_can(access_s2member_level4)]Please register for PREMIUM VERSION HERE to read full post below containing analysis. In case of any error or you think you are not able to read the full post below, please email us at support#nehcap.com [lwa][/s2If] [s2If current_user_can(access_s2member_level4)]
- EUR/JPY tumbles beneath the 140.00 figure as the cross dives below the 200-DMA and the 20-day crosses below the 100-DMA.
- A megaphone top formation suggests that downward pressure lies ahead on the EUR/JPY.
- EUR/JPY Price Analysis: Once it clears 138.80, a fall to 135.51 is on the cards.
The pair currently trades last at 139.450.
The previous day high was 141.95 while the previous day low was 140.0. The daily 38.2% Fib levels comes at 140.74, expected to provide resistance. Similarly, the daily 61.8% fib level is at 141.2, expected to provide resistance.
The EUR/JPY drops below the 200-day Exponential Moving Average (EMA) at 140.18, extending its losses to three consecutive trading days, falling 2.40% since peaking around the last week’s high of 142.93. Hence, the EUR/JPY is trading at 139.26, below its opening price, after hitting a daily high of 140.31.s
From a daily chart perspective, the EUR/JPY is forming a megaphone top formation, usually a bearish formation, which was confirmed once the cross-currency pair broke below the 200-day EMA. Also, the 20-day EMA crossed below the 100-day EMA, exacerbating an acceleration of the downtrend, as sellers eye a break below the December 2022 low of 138.80.
Oscillators like the Relative Strength Index (RSI), aiming toward oversold conditions and the Rate of Change (RoC) staying below its zero line, confirm that sellers are in charge.
Therefore, the EUR/JPY first support would be the December low of 138.80. A breach of the latter will expose the September 26 daily low of 137.36, followed by the August 24 swing low of 135.51.
As an alternate scenario, if the EUR/JPY climbs back above the 200-day EMA, a rally toward the 20-day EMA at 142.21 is on the cards. Once cleared, it would expose the 100-day EMA at 142.43.
Technical Levels: Supports and Resistances
EURJPY currently trading at 139.39 at the time of writing. Pair opened at 140.55 and is trading with a change of -0.83 % .
| Overview | Overview.1 | |
|---|---|---|
| 0 | Today last price | 139.39 |
| 1 | Today Daily Change | -1.16 |
| 2 | Today Daily Change % | -0.83 |
| 3 | Today daily open | 140.55 |
The pair remains strongly bearish on the daily time frame. It trades below the 20 SMA @ 142.92, 50 SMA 144.26, 100 SMA @ 142.77 and 200 SMA @ 140.45.
| Trends | Trends.1 | |
|---|---|---|
| 0 | Daily SMA20 | 142.92 |
| 1 | Daily SMA50 | 144.26 |
| 2 | Daily SMA100 | 142.77 |
| 3 | Daily SMA200 | 140.45 |
The previous day high was 141.95 while the previous day low was 140.0. The daily 38.2% Fib levels comes at 140.74, expected to provide resistance. Similarly, the daily 61.8% fib level is at 141.2, expected to provide resistance.
Note the levels of interest below:
- Pivot support is noted at 139.72, 138.88, 137.76
- Pivot resistance is noted at 141.67, 142.79, 143.63
| Levels | Levels.1 |
|---|---|
| Previous Daily High | 141.95 |
| Previous Daily Low | 140.00 |
| Previous Weekly High | 142.94 |
| Previous Weekly Low | 140.00 |
| Previous Monthly High | 146.73 |
| Previous Monthly Low | 138.80 |
| Daily Fibonacci 38.2% | 140.74 |
| Daily Fibonacci 61.8% | 141.20 |
| Daily Pivot Point S1 | 139.72 |
| Daily Pivot Point S2 | 138.88 |
| Daily Pivot Point S3 | 137.76 |
| Daily Pivot Point R1 | 141.67 |
| Daily Pivot Point R2 | 142.79 |
| Daily Pivot Point R3 | 143.63 |
[/s2If]
Join Our Telegram Group
")


