#EURUSD @ 1.06620 Eurozone S&P Global Manufacturing PMIs were mixed and weighed on the EUR. (Pivot Orderbook analysis)
…
This is a premium post.
[s2If !current_user_can(access_s2member_level4)]Please register for PREMIUM VERSION HERE to read full post below containing analysis. In case of any error or you think you are not able to read the full post below, please email us at support#nehcap.com [lwa][/s2If] [s2If current_user_can(access_s2member_level4)]
- Eurozone S&P Global Manufacturing PMIs were mixed and weighed on the EUR.
- European Central Bank Nagel said the ECB needs to take further action to tackle inflation.
- EUR/USD Price Analysis: Failure to crack 1.0700, to pave the way to 1.0600 and below.
The pair currently trades last at 1.06620.
The previous day high was 1.0713 while the previous day low was 1.0639. The daily 38.2% Fib levels comes at 1.0685, expected to provide resistance. Similarly, the daily 61.8% fib level is at 1.0667, expected to provide resistance.
The Euro (EUR) sheds some ground against the US Dollar (USD) on the first trading day of 2023 amidst thin liquidity conditions in the financial markets. The release of S&P Global PMIs in the Eurozone failed to bolster the shared currency on Monday. At the time of writing, the EUR/USD is trading at 1.0657 after hitting a daily high of 1.0699.
European equities are trading in the green. S&P Global revealed the Purchasing Managers Index (PMI) for factory activity in the EU, which came mixed with Spain and France’s Manufacturing PMI exceeding estimates, contrarily to Germany, which extended its downward trajectory to 47.1. Italy and the whole Euro area remained unchanged, each at 48.5 and 47.8.
In the meantime, the Bundesbank President and European Central Bank (ECB) policymaker Joachim Nagel crossed newswires on a german newspaper, and he said he’s optimistic that Germany can avoid a serious economic slump. Nagel added that the ECB was not seeing a wage spiral and reiterated that the ECB needs to take further action to curb inflation expectations.
In the meantime, the US Dollar Index, a measure of the buck’s value against a basket of peers, climbs 0.14% to 103.63, off six-month lows hit during the last week at 103.38. the lack of US and Canadian economic data keeps traders leaning on market mood and technicals.
Ahead of the week, the Eurozone economic docket will feature employment data in Germany alongside the inflation rate. Regarding the US economic calendar, the S&P Global Manufacturing PMI for December is expected to remain at 46.2, which could be a prelude to the Institute for Supply Management (ISM) factory activity on Wednesday.
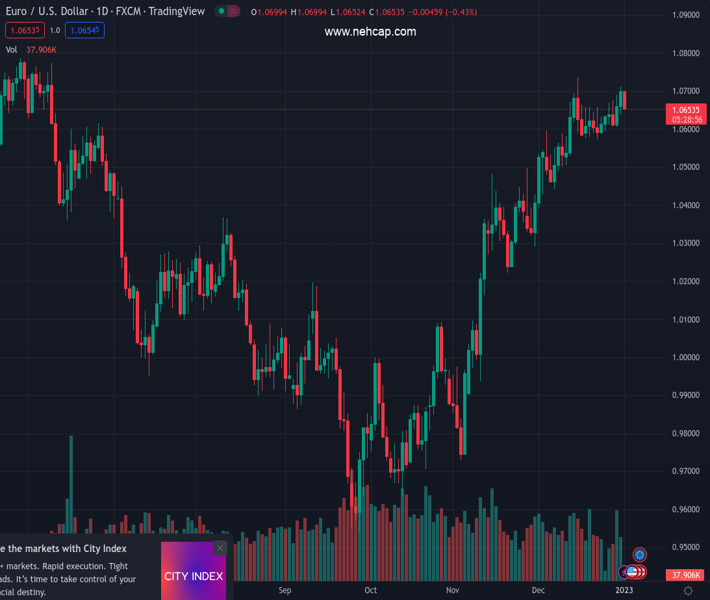
The EUR/USD daily chart suggests the pair might be peaking at around 1.0700, unable to crack in December, and it’s trimming some of its early gains, edged toward 1.0660s. Even though it broke above an eight-month-old downslope trendline, the EUR/USD faltered to extend its gains, opening the door for a re-test of the previously mentioned trendline at around 1.0550. Oscillators like the Relative Strength Index (RSI) and the Rate of Change (RoC) started to aim down, suggesting that sellers are beginning to gather momentum. Therefore, the EUR/USD first support would be the 1.0600 mark, followed by the 20-day Exponential Moving Average (EMA) at 1.0584, ahead of 1.0550.
Technical Levels: Supports and Resistances
EURUSD currently trading at 1.0669 at the time of writing. Pair opened at 1.0706 and is trading with a change of -0.35 % .
| Overview | Overview.1 | |
|---|---|---|
| 0 | Today last price | 1.0669 |
| 1 | Today Daily Change | -0.0037 |
| 2 | Today Daily Change % | -0.3500 |
| 3 | Today daily open | 1.0706 |
The pair remains strongly bullish on the daily timeframe. It trades above its 20 SMA @ 1.0595, 50 SMA 1.0347, 100 SMA @ 1.0126 and 200 SMA @ 1.0325.
| Trends | Trends.1 | |
|---|---|---|
| 0 | Daily SMA20 | 1.0595 |
| 1 | Daily SMA50 | 1.0347 |
| 2 | Daily SMA100 | 1.0126 |
| 3 | Daily SMA200 | 1.0325 |
The previous day high was 1.0713 while the previous day low was 1.0639. The daily 38.2% Fib levels comes at 1.0685, expected to provide resistance. Similarly, the daily 61.8% fib level is at 1.0667, expected to provide resistance.
Note the levels of interest below:
- Pivot support is noted at 1.0658, 1.0611, 1.0584
- Pivot resistance is noted at 1.0733, 1.076, 1.0808
| Levels | Levels.1 |
|---|---|
| Previous Daily High | 1.0713 |
| Previous Daily Low | 1.0639 |
| Previous Weekly High | 1.0713 |
| Previous Weekly Low | 1.0607 |
| Previous Monthly High | 1.0736 |
| Previous Monthly Low | 1.0393 |
| Daily Fibonacci 38.2% | 1.0685 |
| Daily Fibonacci 61.8% | 1.0667 |
| Daily Pivot Point S1 | 1.0658 |
| Daily Pivot Point S2 | 1.0611 |
| Daily Pivot Point S3 | 1.0584 |
| Daily Pivot Point R1 | 1.0733 |
| Daily Pivot Point R2 | 1.0760 |
| Daily Pivot Point R3 | 1.0808 |
[/s2If]
Join Our Telegram Group
")


