#EURUSD @ 1.07000 seesaws near seven-month high, snaps two-day winning streak., @nehcap view: Downside expected (Pivot Orderbook analysis)
…
This is a premium post.
[s2If !current_user_can(access_s2member_level4)]Please register for PREMIUM VERSION HERE to read full post below containing analysis. In case of any error or you think you are not able to read the full post below, please email us at support#nehcap.com [lwa][/s2If] [s2If current_user_can(access_s2member_level4)]
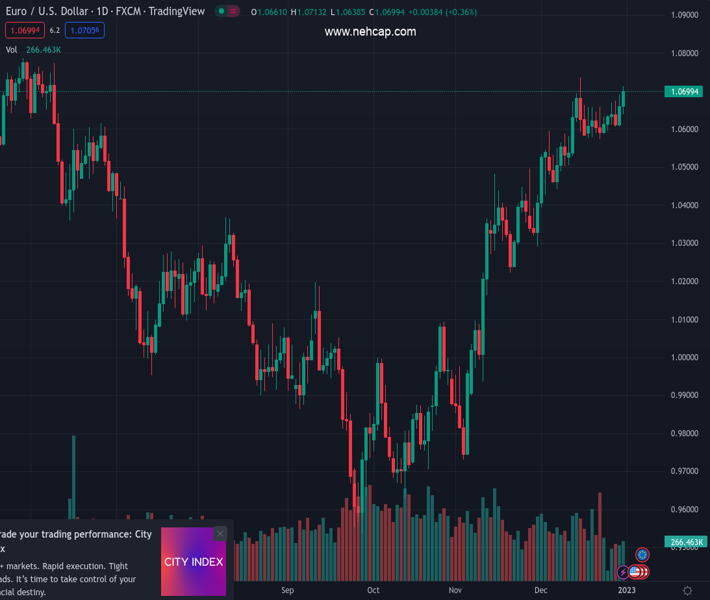
- EUR/USD seesaws near seven-month high, snaps two-day winning streak.
- One-week-old previous resistance puts a floor under the prices even as buyers appear to run out of steam.
- 50-HMA, ascending trend line from December 22 act as additional downside filters.
The pair currently trades last at 1.07000.
The previous day high was 1.0713 while the previous day low was 1.0639. The daily 38.2% Fib levels comes at 1.0685, expected to provide support. Similarly, the daily 61.8% fib level is at 1.0667, expected to provide support.
EUR/USD portrays exhaustion of the previous bull-run amid Monday’s holiday-inspired lackluster trading day.
Also read: EUR/USD portrays tepid start to 2023 after a volatile year, ECB vs. Fed talks, US NFP eyed
In doing so, the major currency pair fades the previous day’s upside break of the one-week-old resistance line, now support.
The EUR/USD pair’s retreat also takes clues from the bearish MACD signals and steady RSI, adding strength to the bearish bias.
However, a clear downside break of 1.0690 becomes necessary for the major currency pair to recall the bears.
Even so, 50-HMA and an upward-sloping support line from December 22, respectively near 1.0665 and 1.0630, could restrict the quote’s further downside.
In a case where the EUR/USD price remains weak past 1.0630, the late December swing low near 1.0570 could lure the pair bears.
Alternatively, buyers need validation from the immediate resistance line, as well as the monthly, respectively around 1.0708 and 1.0713, to direct prices towards May 2022 peak surrounding 1.0785.
Following that, the 1.0800 could probe the EUR/USD bulls before highlighting the late April 2022 swing high of 1.0936 as the key hurdle to the north.
Overall, EUR/USD remains on the buyer’s radar but a short-term pullback appears to brew of late.
Trend: Downside expected
Technical Levels: Supports and Resistances
EURUSD currently trading at 1.0702 at the time of writing. Pair opened at 1.0706 and is trading with a change of -0.04% % .
| Overview | Overview.1 | |
|---|---|---|
| 0 | Today last price | 1.0702 |
| 1 | Today Daily Change | -0.0004 |
| 2 | Today Daily Change % | -0.04% |
| 3 | Today daily open | 1.0706 |
The pair remains strongly bullish on the daily timeframe. It trades above its 20 SMA @ 1.0595, 50 SMA 1.0347, 100 SMA @ 1.0126 and 200 SMA @ 1.0325.
| Trends | Trends.1 | |
|---|---|---|
| 0 | Daily SMA20 | 1.0595 |
| 1 | Daily SMA50 | 1.0347 |
| 2 | Daily SMA100 | 1.0126 |
| 3 | Daily SMA200 | 1.0325 |
The previous day high was 1.0713 while the previous day low was 1.0639. The daily 38.2% Fib levels comes at 1.0685, expected to provide support. Similarly, the daily 61.8% fib level is at 1.0667, expected to provide support.
Note the levels of interest below:
- Pivot support is noted at 1.0658, 1.0611, 1.0584
- Pivot resistance is noted at 1.0733, 1.076, 1.0808
| Levels | Levels.1 |
|---|---|
| Previous Daily High | 1.0713 |
| Previous Daily Low | 1.0639 |
| Previous Weekly High | 1.0713 |
| Previous Weekly Low | 1.0607 |
| Previous Monthly High | 1.0736 |
| Previous Monthly Low | 1.0393 |
| Daily Fibonacci 38.2% | 1.0685 |
| Daily Fibonacci 61.8% | 1.0667 |
| Daily Pivot Point S1 | 1.0658 |
| Daily Pivot Point S2 | 1.0611 |
| Daily Pivot Point S3 | 1.0584 |
| Daily Pivot Point R1 | 1.0733 |
| Daily Pivot Point R2 | 1.0760 |
| Daily Pivot Point R3 | 1.0808 |
[/s2If]
Join Our Telegram Group
")


