#NZDUSD @ 0.63420 prints mild losses around a two-week high, justifies the previous day’s bearish candlestick formation., @nehcap view: Limited downside expected (Pivot Orderbook analysis)
…
This is a premium post.
[s2If !current_user_can(access_s2member_level4)]Please register for PREMIUM VERSION HERE to read full post below containing analysis. In case of any error or you think you are not able to read the full post below, please email us at support#nehcap.com [lwa][/s2If] [s2If current_user_can(access_s2member_level4)]
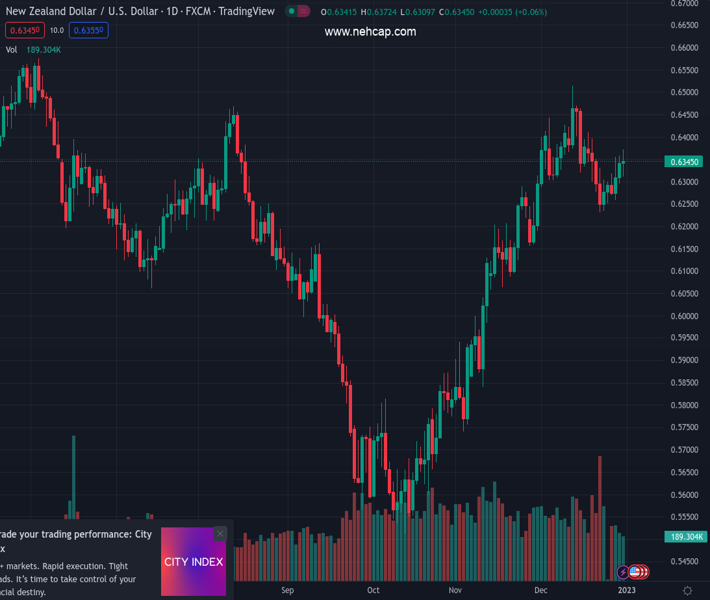
- NZD/USD prints mild losses around a two-week high, justifies the previous day’s bearish candlestick formation.
- Previous support line from October, bearish MACD signals also keeps sellers hopeful.
- 200-day EMA holds the key to Kiwi bear’s conviction.
The pair currently trades last at 0.63420.
The previous day high was 0.6373 while the previous day low was 0.631. The daily 38.2% Fib levels comes at 0.6334, expected to provide support. Similarly, the daily 61.8% fib level is at 0.6349, expected to provide resistance.
NZD/USD holds lower ground near the intraday bottom of 0.6329 during the mid-Asian session on a sluggish Monday. The Kiwi pair’s latest inaction could be linked to the holidays in multiple markets, including New Zealand.
Even so, the quote prints mild losses while justifying the previous day’s bearish Doji candlestick. Also favoring the NZD/USD bears are the bearish MACD signals and the pair’s sustained trading below the previous support line from October 13, now resistance around 0.6400.
As a result, the Kiwi pair is likely to extend the latest weakness toward the 200-day Exponential Moving Average (EMA) support surrounding 0.6235.
During the fall, the 0.6300 round figure may act as an intermediate halt whereas the late November swing low around 0.6155 could challenge the NZD/USD bears afterward.
On the contrary, the Kiwi pair’s successful trading above 0.6400 support-turned-resistance could propel the quote toward the previous monthly high near 0.6515.
It’s worth noting that the NZD/USD pair’s sustained run-up beyond 0.6515 enables the bulls to aim for a June 2022 high of 0.6575.
Overall, NZD/USD is likely to extend the latest pullback but the downside room appears limited.
Trend: Limited downside expected
Technical Levels: Supports and Resistances
NZDUSD currently trading at 0.634 at the time of writing. Pair opened at 0.6348 and is trading with a change of -0.13% % .
| Overview | Overview.1 | |
|---|---|---|
| 0 | Today last price | 0.634 |
| 1 | Today Daily Change | -0.0008 |
| 2 | Today Daily Change % | -0.13% |
| 3 | Today daily open | 0.6348 |
The pair is trading below its 20 Daily moving average @ 0.6346, above its 50 Daily moving average @ 0.616 , above its 100 Daily moving average @ 0.604 and above its 200 Daily moving average @ 0.6241
| Trends | Trends.1 | |
|---|---|---|
| 0 | Daily SMA20 | 0.6346 |
| 1 | Daily SMA50 | 0.6160 |
| 2 | Daily SMA100 | 0.6040 |
| 3 | Daily SMA200 | 0.6241 |
The previous day high was 0.6373 while the previous day low was 0.631. The daily 38.2% Fib levels comes at 0.6334, expected to provide support. Similarly, the daily 61.8% fib level is at 0.6349, expected to provide resistance.
Note the levels of interest below:
- Pivot support is noted at 0.6315, 0.6281, 0.6252
- Pivot resistance is noted at 0.6377, 0.6406, 0.644
| Levels | Levels.1 |
|---|---|
| Previous Daily High | 0.6373 |
| Previous Daily Low | 0.6310 |
| Previous Weekly High | 0.6373 |
| Previous Weekly Low | 0.6253 |
| Previous Monthly High | 0.6514 |
| Previous Monthly Low | 0.6230 |
| Daily Fibonacci 38.2% | 0.6334 |
| Daily Fibonacci 61.8% | 0.6349 |
| Daily Pivot Point S1 | 0.6315 |
| Daily Pivot Point S2 | 0.6281 |
| Daily Pivot Point S3 | 0.6252 |
| Daily Pivot Point R1 | 0.6377 |
| Daily Pivot Point R2 | 0.6406 |
| Daily Pivot Point R3 | 0.6440 |
[/s2If]
Join Our Telegram Group
")


