#AUDUSD @ 0.68020 pares intraday losses at the highest levels in 12 days., @nehcap view: Pullback expected (Pivot Orderbook analysis)
…
This is a premium post.
[s2If !current_user_can(access_s2member_level4)]Please register for PREMIUM VERSION HERE to read full post below containing analysis. In case of any error or you think you are not able to read the full post below, please email us at support#nehcap.com [lwa][/s2If] [s2If current_user_can(access_s2member_level4)]
- AUD/USD pares intraday losses at the highest levels in 12 days.
- Sluggish RSI, MACD signals also favor pullback moves targeting previous resistance from mid-December.
- 200-SMA adds to the downside filters, bulls need validation from previous monthly high to keep the reins.
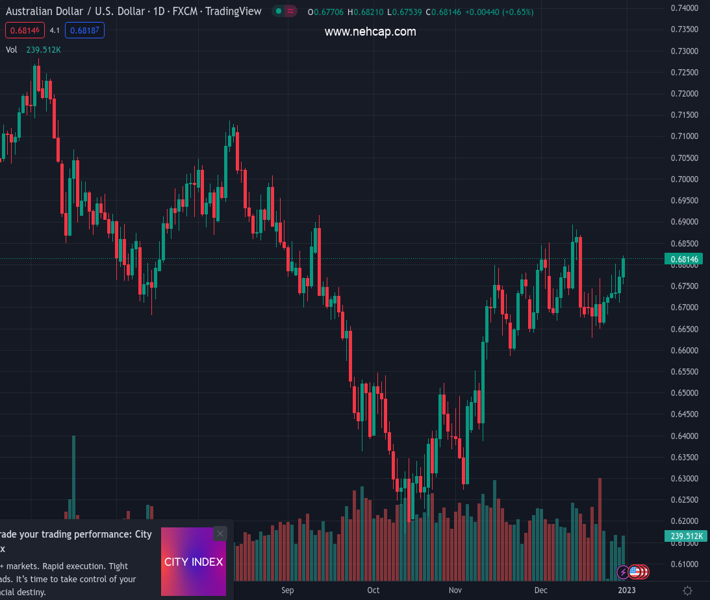
The pair currently trades last at 0.68020.
The previous day high was 0.6821 while the previous day low was 0.6753. The daily 38.2% Fib levels comes at 0.6795, expected to provide support. Similarly, the daily 61.8% fib level is at 0.6779, expected to provide support.
AUD/USD retreats from the short-term key resistance during Monday’s Asian session as bulls take a breather after a three-day uptrend. In doing so, the Aussie pair steps back from a three-week-old horizontal resistance amid nearly overbought RSI and sluggish MACD signals.
It’s worth noting, however, that the previous week’s successful upside break of a descending trend line from November 13, close to 0.6780 by the press time, keeps the AUD/USD buyers hopeful.
Even if the quote breaks the 0.6780 support, the 200-HMA level surrounding 0.6725 acts as the last defense of the AUD/USD buyers before giving control to the Aussie pair sellers.
In that case, the Aussie pair bears could quickly aim for the previous monthly low near 0.6690.
On the contrary, a successful upside break of the three-week-old horizontal resistance area surrounding 0.6820-25 could propel the pair towards the previous monthly high surrounding 0.6895.
Following that, the pair’s successful trading beyond the 0.6900 round figure, as well as September’s high near 0.6920, becomes necessary for the AUD/USD bulls to aim for an August 2022 high of around 0.7135.
Overall, AUD/USD remains on the buyer’s radar but the upside room appears limited.
Trend: Pullback expected
Technical Levels: Supports and Resistances
AUDUSD currently trading at 0.6814 at the time of writing. Pair opened at 0.6808 and is trading with a change of 0.09% % .
| Overview | Overview.1 | |
|---|---|---|
| 0 | Today last price | 0.6814 |
| 1 | Today Daily Change | 0.0006 |
| 2 | Today Daily Change % | 0.09% |
| 3 | Today daily open | 0.6808 |
The pair is trading above its 20 Daily moving average @ 0.6738, above its 50 Daily moving average @ 0.6645 , above its 100 Daily moving average @ 0.6642 and below its 200 Daily moving average @ 0.6863
| Trends | Trends.1 | |
|---|---|---|
| 0 | Daily SMA20 | 0.6738 |
| 1 | Daily SMA50 | 0.6645 |
| 2 | Daily SMA100 | 0.6642 |
| 3 | Daily SMA200 | 0.6863 |
The previous day high was 0.6821 while the previous day low was 0.6753. The daily 38.2% Fib levels comes at 0.6795, expected to provide support. Similarly, the daily 61.8% fib level is at 0.6779, expected to provide support.
Note the levels of interest below:
- Pivot support is noted at 0.6767, 0.6726, 0.6698
- Pivot resistance is noted at 0.6835, 0.6863, 0.6904
| Levels | Levels.1 |
|---|---|
| Previous Daily High | 0.6821 |
| Previous Daily Low | 0.6753 |
| Previous Weekly High | 0.6821 |
| Previous Weekly Low | 0.6710 |
| Previous Monthly High | 0.6893 |
| Previous Monthly Low | 0.6629 |
| Daily Fibonacci 38.2% | 0.6795 |
| Daily Fibonacci 61.8% | 0.6779 |
| Daily Pivot Point S1 | 0.6767 |
| Daily Pivot Point S2 | 0.6726 |
| Daily Pivot Point S3 | 0.6698 |
| Daily Pivot Point R1 | 0.6835 |
| Daily Pivot Point R2 | 0.6863 |
| Daily Pivot Point R3 | 0.6904 |
[/s2If]
Join Our Telegram Group
")


