#AUDUSD @ 0.66637 The fell below the 0.6700 level after posting 0.30% losses. (Pivot Orderbook analysis)
…
This is a premium post.
[s2If !current_user_can(access_s2member_level4)]Please register for FREE REGISTER to read full post below containing analysis. In case of any error or you think you are not able to read the full post below, please email us at support#nehcap.com [lwa][/s2If] [s2If current_user_can(access_s2member_level1)]
- The AUD/USD fell below the 0.6700 level after posting 0.30% losses.
- Surging US CPI in December made dovish bets on the Fed ease.
- The downside for the pair is limited as the odds of a cut in March from the Fed are high.
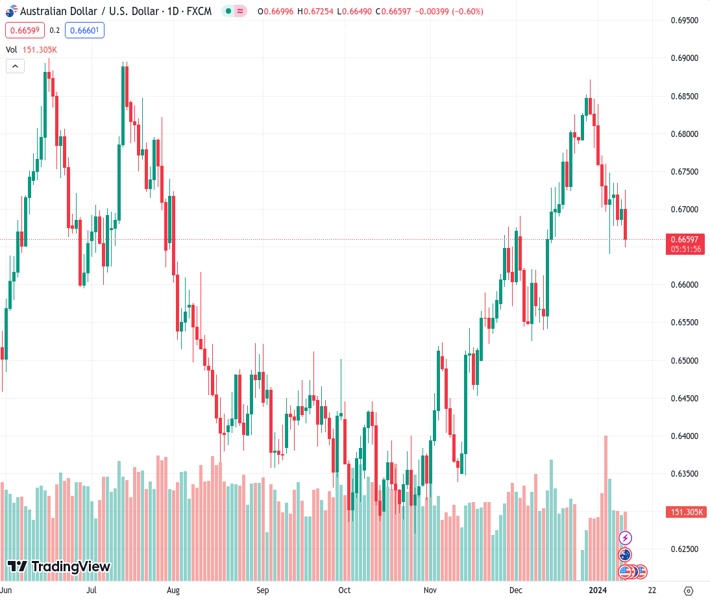
The pair currently trades last at 0.66637.
The previous day high was 0.6713 while the previous day low was 0.668. The daily 38.2% Fib levels comes at 0.67, expected to provide resistance. Similarly, the daily 61.8% fib level is at 0.6693, expected to provide resistance.
The Australian Dollar (AUD) softened on Thursday, tallying losses against the US dollar (USD), with the pair reaching near the 0.6685 mark. Major contributors to this downturn movement are the surprisingly higher than-anticipated Consumer Price Index (CPI) data from the United States, which made dovish bets on the Federal Reserve (Fed) ease.
On Thursday, the US Bureau of Labor Statistics revealed that the Consumer Price Index (CPI) escalated to 3.4% YoY in December, surpassing November’s 3.1% and the predicted 3.2% market figure. Moreover, December’s monthly CPI growth experienced a 0.3% rise, besting the estimated projection of 0.2% as predicted by market analysts. The Core CPI came in at 3.9%, down from 4% in November.
Following the release, dovish bets on the Federal Reserve (Fed) eased somewhat, but according to the CME FedWatch Tool, they are still high. In that sense, investors remain stubborn and are betting on higher than 50% odds of a cut in March and May, which would leave the target rate at 450-475 bps by June. As long as the markets strengthen the dovish rhetoric, the upside for the Greenback will be limited.
The daily chart indicates that there is a mixed stance towards the pair. The negative slope in the Relative Strength Index (RSI) and its position in negative territory communicate an underlying selling momentum. This implies that sellers have recently had the upper hand and suggests a possible downtrend continuation. This aligns with the rising red bars of the the Moving Average Convergence Divergence (MACD)
Bringing in the perspective of the Simple Moving Averages (SMAs), the pair is positioned below the 20-day SMA, suggesting a shorter-term bearish bias. Yet, since it’s standing above the 100 and 200-day SMAs, the longer-term trend appears to be bullish. This points to the fact that the bulls are still in control in the larger time frames despite the recent bearish developments.
Technical Levels: Supports and Resistances
AUDUSD currently trading at 0.6672 at the time of writing. Pair opened at 0.6697 and is trading with a change of -0.37 % .
| Overview | Overview.1 | |
|---|---|---|
| 0 | Today last price | 0.6672 |
| 1 | Today Daily Change | -0.0025 |
| 2 | Today Daily Change % | -0.3700 |
| 3 | Today daily open | 0.6697 |
The pair is trading below its 20 Daily moving average @ 0.6757, above its 50 Daily moving average @ 0.6623 , above its 100 Daily moving average @ 0.6507 and above its 200 Daily moving average @ 0.6583
| Trends | Trends.1 | |
|---|---|---|
| 0 | Daily SMA20 | 0.6757 |
| 1 | Daily SMA50 | 0.6623 |
| 2 | Daily SMA100 | 0.6507 |
| 3 | Daily SMA200 | 0.6583 |
The previous day high was 0.6713 while the previous day low was 0.668. The daily 38.2% Fib levels comes at 0.67, expected to provide resistance. Similarly, the daily 61.8% fib level is at 0.6693, expected to provide resistance.
Note the levels of interest below:
- Pivot support is noted at 0.668, 0.6664, 0.6648
- Pivot resistance is noted at 0.6713, 0.6729, 0.6746
| Levels | Levels.1 |
|---|---|
| Previous Daily High | 0.6713 |
| Previous Daily Low | 0.6680 |
| Previous Weekly High | 0.6839 |
| Previous Weekly Low | 0.6641 |
| Previous Monthly High | 0.6871 |
| Previous Monthly Low | 0.6526 |
| Daily Fibonacci 38.2% | 0.6700 |
| Daily Fibonacci 61.8% | 0.6693 |
| Daily Pivot Point S1 | 0.6680 |
| Daily Pivot Point S2 | 0.6664 |
| Daily Pivot Point S3 | 0.6648 |
| Daily Pivot Point R1 | 0.6713 |
| Daily Pivot Point R2 | 0.6729 |
| Daily Pivot Point R3 | 0.6746 |
[/s2If]
Nehcap Expert Advisor
The NEHCAP MT4 EA is high quality professional trading system geared to generate returns without using GRID or martingales. Each trade has strict risk per trade parameter. The pairs under management include EURUSD, GBPUSD, AUDCAD, AUDNZD,GBPAUD, EURAUD, EURCAD, CHFJPY and many more.
The system is trading live: LIVE ACCOUNT TRACKING
You can run it free. Apply for a free trial and track our account. Buy the system or use profit share mechanism to generate returns on your MT4.
Join Our Telegram Group
")


