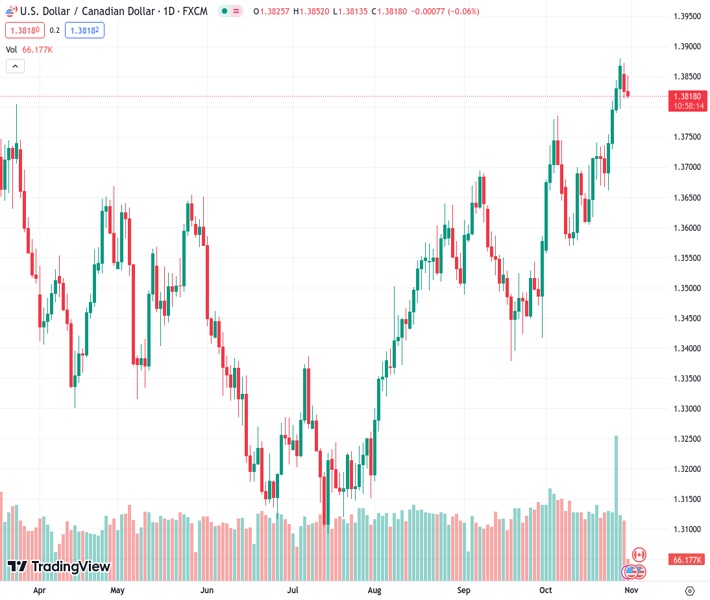
#USDCAD @ 1.38147 attracts some intraday selling on Tuesday, though the downside remains limited.
…
This is a premium post.
[s2If !current_user_can(access_s2member_level4)]Please register for FREE REGISTER to read full post below containing analysis. In case of any error or you think you are not able to read the full post below, please email us at support#nehcap.com [lwa][/s2If] [s2If current_user_can(access_s2member_level1)]
- USD/CAD attracts some intraday selling on Tuesday, though the downside remains limited.
The pair currently trades last at 1.38147.
The previous day high was 1.3873 while the previous day low was 1.3813. The daily 38.2% Fib levels comes at 1.3836, expected to provide resistance. Similarly, the daily 61.8% fib level is at 1.385, expected to provide resistance.
The USD/CAD pair attracts fresh sellers following an intraday uptick to mid-1.3800s and drops to a fresh daily low during the first half of the European session. Spot prices, however, manage to hold above the 1.3800 round figure and seem poised to prolong over a three-week-old uptrend.
A modest uptick in Crude Oil prices is seen underpinning the commodity-linked Loonie. Apart from this, a generally positive tone around the equity markets drags the safe-haven US Dollar (USD) to a one-week low, which, in turn, is seen exerting some pressure on the USD/CAD pair. Any meaningful corrective decline, however, still seems elusive ahead of the key central bank event risk – the outcome of the highly-anticipated two-day FOMC monetary policy meeting starting this Tuesday.
The Federal Reserve (Fed) is scheduled to announce its decision on Wednesday and is widely anticipated to keep its benchmark interest rate steady in the range of 5.25%-5.50%, or the highest in 22 years. That said, the US economic resilience, along with still sticky inflation, should allow the US central bank to keep the door open for one more rate hike in 2023. The hawkish outlook remains supportive of elevated US Treasury bond yields, which should lend support to the buck and the USD/CAD pair.
Furthermore, investors remain concerned about the worsening economic conditions in China – the world’s top oil importer. This, along with worries that headwinds stemming from rapidly rising borrowing costs could dent fuel demand, keeps a lid on any meaningful upside for Crude Oil prices. Apart from this, the Bank of Canada (BoC) Governor Tiff Macklem’s dovish signal last week, indicating that interest rates may have peaked, should contribute to limiting the downside for the USD/CAD pair.
Next on tap is the US economic docket – featuring the release of the Chicago PMI and the Conference Board’s Consumer Confidence Index later during the early North American session. Apart from this, the US bond yields will drive the USD demand, which, along with Oil price dynamics, should provide some impetus to the USD/CAD pair. Nevertheless, the aforementioned fundamental backdrop suggests that the path of least resistance for spot prices is to the upside.
Technical Levels: Supports and Resistances
USDCAD currently trading at 1.3826 at the time of writing. Pair opened at 1.3827 and is trading with a change of -0.01 % .
| Overview | Overview.1 | |
|---|---|---|
| 0 | Today last price | 1.3826 |
| 1 | Today Daily Change | -0.0001 |
| 2 | Today Daily Change % | -0.0100 |
| 3 | Today daily open | 1.3827 |
The pair remains strongly bullish on the daily timeframe. It trades above its 20 SMA @ 1.3705, 50 SMA 1.3612, 100 SMA @ 1.3449 and 200 SMA @ 1.3482.
| Trends | Trends.1 | |
|---|---|---|
| 0 | Daily SMA20 | 1.3705 |
| 1 | Daily SMA50 | 1.3612 |
| 2 | Daily SMA100 | 1.3449 |
| 3 | Daily SMA200 | 1.3482 |
The previous day high was 1.3873 while the previous day low was 1.3813. The daily 38.2% Fib levels comes at 1.3836, expected to provide resistance. Similarly, the daily 61.8% fib level is at 1.385, expected to provide resistance.
Note the levels of interest below:
- Pivot support is noted at 1.3802, 1.3778, 1.3742
- Pivot resistance is noted at 1.3862, 1.3898, 1.3922
| Levels | Levels.1 |
|---|---|
| Previous Daily High | 1.3873 |
| Previous Daily Low | 1.3813 |
| Previous Weekly High | 1.3881 |
| Previous Weekly Low | 1.3661 |
| Previous Monthly High | 1.3694 |
| Previous Monthly Low | 1.3379 |
| Daily Fibonacci 38.2% | 1.3836 |
| Daily Fibonacci 61.8% | 1.3850 |
| Daily Pivot Point S1 | 1.3802 |
| Daily Pivot Point S2 | 1.3778 |
| Daily Pivot Point S3 | 1.3742 |
| Daily Pivot Point R1 | 1.3862 |
| Daily Pivot Point R2 | 1.3898 |
| Daily Pivot Point R3 | 1.3922 |
[/s2If]
Download Nehcap EAWe have two EAs that are operational on our LIVE accounts.
- EA-FIX: Check out the details here. Download EA-FIX . EA-FIX is a non-grid HFT scalper.
- EA-GROWTH: High quality low dd EA using trend grids. Download EA_GROWTHJoin Our Telegram Group
")


