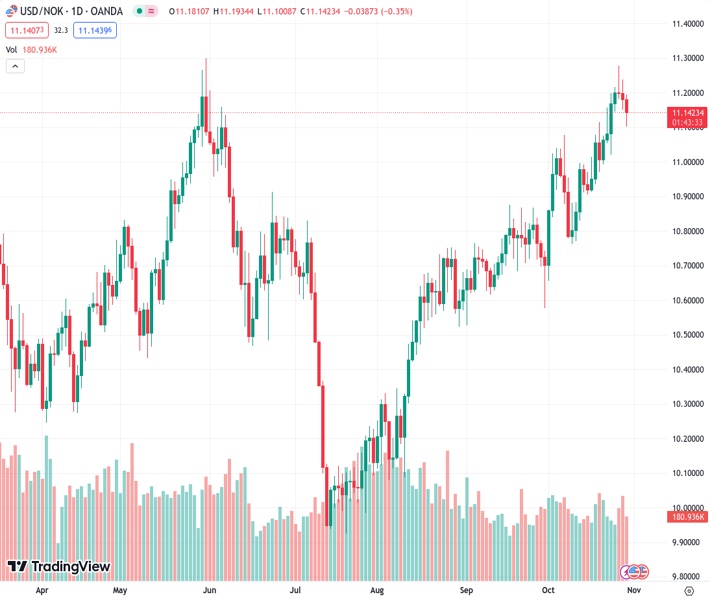
#USDNOK @ 11.14060 is down for a third consecutive day, trading at 11.142
…
This is a premium post.
[s2If !current_user_can(access_s2member_level4)]Please register for FREE REGISTER to read full post below containing analysis. In case of any error or you think you are not able to read the full post below, please email us at support#nehcap.com [lwa][/s2If] [s2If current_user_can(access_s2member_level1)]
- USD/NOK is down for a third consecutive day, trading at 11.142
The pair currently trades last at 11.14060.
The previous day high was 11.2387 while the previous day low was 11.1506. The daily 38.2% Fib levels comes at 11.1843, expected to provide resistance. Similarly, the daily 61.8% fib level is at 11.2051, expected to provide resistance.
In Monday’s session, the USD/NOK is down, driven by a broad US Dollar (USD) weakness, which falls on the back of a positive market environment and investors taking profits after last week’s gains. Focus now shifts to the Federal Reserve (Fed) Interest Rate Decision on Wednesday and Nonfarm Payrolls on Friday, which would set the pair’s pace in the upcoming sessions. On the NOK’s side, the Norges Bank meeting ends on Thursday with no rate hikes priced in
Recently, the USD strengthened over the NOK mainly due to rising US Treasury yields and strong economic reports, including a preliminary estimate of the US Q3 preliminary estimate of the Gross Domestic Product (GDP) which grew at an annualised rate of more than 4%. Nevertheless, the prospects of a 25 basis point increase in December, according to the CME FedWatch tool, continue to be low, potentially tempering any considerable advancement for the USD. For Wednesday’s meeting, a pause is largely priced in, but Chair Powell’s tone will be closely looked upon for investors to continue modelling their expectations.
Furthermore, the US will report October’s Nonfarm Payrolls, an important labour market indicator closely monitored by the Fed, which could also impact the pair’s price dynamics.
On the other hand, investors will monitor the Norges Bank’s stance on Thursday. In September, Governor Bache stated that “There will likely be an additional hike in December” so in case the bank gives more clues on their plans for the December meeting, the NOK’s could gain further ground over the US Dollar.
Evaluating the daily chart, signs of bullish exhaustion for USD/NOK are observed, contributing to a neutral to bearish technical stance. The Relative Strength Index (RSI) displays a negative slope in the bullish territory, hinting at a potential shift in momentum, while the Moving Average Convergence (MACD) prints shorter green bars.
Support levels: 11.100, 11.083, 11.023 (20-day SMA),
Resistance levels: 11.200, 11.235, 11.276.
Technical Levels: Supports and Resistances
USDNOK currently trading at 11.1433 at the time of writing. Pair opened at 11.1918 and is trading with a change of -0.43 % .
| Overview | Overview.1 | |
|---|---|---|
| 0 | Today last price | 11.1433 |
| 1 | Today Daily Change | -0.0485 |
| 2 | Today Daily Change % | -0.4300 |
| 3 | Today daily open | 11.1918 |
The pair remains strongly bullish on the daily timeframe. It trades above its 20 SMA @ 10.9946, 50 SMA 10.8213, 100 SMA @ 10.6215 and 200 SMA @ 10.5707.
| Trends | Trends.1 | |
|---|---|---|
| 0 | Daily SMA20 | 10.9946 |
| 1 | Daily SMA50 | 10.8213 |
| 2 | Daily SMA100 | 10.6215 |
| 3 | Daily SMA200 | 10.5707 |
The previous day high was 11.2387 while the previous day low was 11.1506. The daily 38.2% Fib levels comes at 11.1843, expected to provide resistance. Similarly, the daily 61.8% fib level is at 11.2051, expected to provide resistance.
Note the levels of interest below:
- Pivot support is noted at 11.1487, 11.1057, 11.0607
- Pivot resistance is noted at 11.2368, 11.2818, 11.3248
| Levels | Levels.1 |
|---|---|
| Previous Daily High | 11.2387 |
| Previous Daily Low | 11.1506 |
| Previous Weekly High | 11.2770 |
| Previous Weekly Low | 11.0206 |
| Previous Monthly High | 10.8758 |
| Previous Monthly Low | 10.5261 |
| Daily Fibonacci 38.2% | 11.1843 |
| Daily Fibonacci 61.8% | 11.2051 |
| Daily Pivot Point S1 | 11.1487 |
| Daily Pivot Point S2 | 11.1057 |
| Daily Pivot Point S3 | 11.0607 |
| Daily Pivot Point R1 | 11.2368 |
| Daily Pivot Point R2 | 11.2818 |
| Daily Pivot Point R3 | 11.3248 |
[/s2If]
Download Nehcap EAWe have two EAs that are operational on our LIVE accounts.
- EA-FIX: Check out the details here. Download EA-FIX . EA-FIX is a non-grid HFT scalper.
- EA-GROWTH: High quality low dd EA using trend grids. Download EA_GROWTHJoin Our Telegram Group
")


