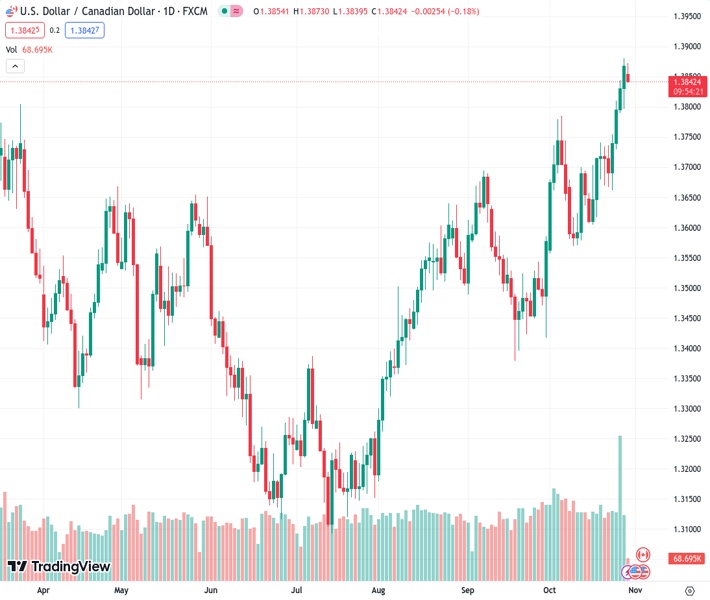
#USDCAD @ 1.38415 falls modestly from one-year high at 1.3880 as the US Dollar retreats.
…
This is a premium post.
[s2If !current_user_can(access_s2member_level4)]Please register for FREE REGISTER to read full post below containing analysis. In case of any error or you think you are not able to read the full post below, please email us at support#nehcap.com [lwa][/s2If] [s2If current_user_can(access_s2member_level1)]
- USD/CAD falls modestly from one-year high at 1.3880 as the US Dollar retreats.
The pair currently trades last at 1.38415.
The previous day high was 1.3881 while the previous day low was 1.3796. The daily 38.2% Fib levels comes at 1.3848, expected to provide resistance. Similarly, the daily 61.8% fib level is at 1.3829, expected to provide support.
The USD/CAD pair falls gradually from the one-year high of 1.3880 in the European session. The Loonie asset drops as the US Dollar Index (DXY) slips sharply from 106.70 as investors shift focus to the interest rate decision by the Federal Reserve (Fed), which will be announced on Wednesday.
The US Dollar Index (DXY) faces selling pressure as investors hope that the Fed is done with hiking interest rates due to higher US Treasury yields. 10-year US bond yields have risen to 4.85% and have tightened financial conditions significantly.
US Treasury Secretary Janet Yellen said last week that high US bond yields reflect strong confidence in the US economy and indicate that interest rates will remain higher for a longer period.
The Canadian Dollar would dance to the tunes of the speech from Bank of Canada (BoC) Governor Tiff Macklem, which is scheduled for Wednesday. BoC Macklem may provide guidance on interest rates and inflation in Canada.
USD/CAD struggles to extend upside above the one-year high around 1.3880. The near-term demand for the Loonie asset remains upbeat as the 20-day Exponential Moving Average (EMA) at 1.3715 is sloping toward north.
The Relative Strength Index (RSI) (14) shifts into the bullish range of 60.00-80.00, which indicates that the bullish momentum has triggered.
A decisive break above October 27 high at 1.3880 would expose the round-level resistance at 1.3900, followed by 13 October 2022 high at 1.3978.
In an alternate scenario, a breakdown below October 24 low around 1.3660 would drag the asset to the round-level support of 1.3600. A further breakdown could expose the asset to October 7 low at 1.3570.
Technical Levels: Supports and Resistances
USDCAD currently trading at 1.3849 at the time of writing. Pair opened at 1.3871 and is trading with a change of -0.16 % .
| Overview | Overview.1 | |
|---|---|---|
| 0 | Today last price | 1.3849 |
| 1 | Today Daily Change | -0.0022 |
| 2 | Today Daily Change % | -0.1600 |
| 3 | Today daily open | 1.3871 |
The pair remains strongly bullish on the daily timeframe. It trades above its 20 SMA @ 1.3698, 50 SMA 1.3607, 100 SMA @ 1.3444 and 200 SMA @ 1.348.
| Trends | Trends.1 | |
|---|---|---|
| 0 | Daily SMA20 | 1.3698 |
| 1 | Daily SMA50 | 1.3607 |
| 2 | Daily SMA100 | 1.3444 |
| 3 | Daily SMA200 | 1.3480 |
The previous day high was 1.3881 while the previous day low was 1.3796. The daily 38.2% Fib levels comes at 1.3848, expected to provide resistance. Similarly, the daily 61.8% fib level is at 1.3829, expected to provide support.
Note the levels of interest below:
- Pivot support is noted at 1.3818, 1.3765, 1.3734
- Pivot resistance is noted at 1.3902, 1.3934, 1.3987
| Levels | Levels.1 |
|---|---|
| Previous Daily High | 1.3881 |
| Previous Daily Low | 1.3796 |
| Previous Weekly High | 1.3881 |
| Previous Weekly Low | 1.3661 |
| Previous Monthly High | 1.3694 |
| Previous Monthly Low | 1.3379 |
| Daily Fibonacci 38.2% | 1.3848 |
| Daily Fibonacci 61.8% | 1.3829 |
| Daily Pivot Point S1 | 1.3818 |
| Daily Pivot Point S2 | 1.3765 |
| Daily Pivot Point S3 | 1.3734 |
| Daily Pivot Point R1 | 1.3902 |
| Daily Pivot Point R2 | 1.3934 |
| Daily Pivot Point R3 | 1.3987 |
[/s2If]
Download Nehcap EAWe have two EAs that are operational on our LIVE accounts.
- EA-FIX: Check out the details here. Download EA-FIX . EA-FIX is a non-grid HFT scalper.
- EA-GROWTH: High quality low dd EA using trend grids. Download EA_GROWTHJoin Our Telegram Group
")


