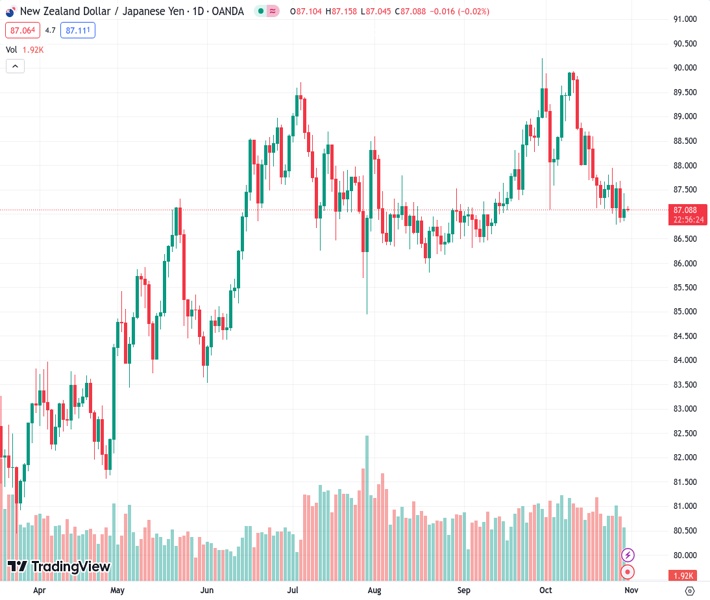
#NZDJPY @ 87.0680 bottomed at a low of 86.809 and then closed at 87.095.
…
This is a premium post.
[s2If !current_user_can(access_s2member_level4)]Please register for FREE REGISTER to read full post below containing analysis. In case of any error or you think you are not able to read the full post below, please email us at support#nehcap.com [lwa][/s2If] [s2If current_user_can(access_s2member_level1)]
- NZD/JPY bottomed at a low of 86.809 and then closed at 87.095.
The pair currently trades last at 87.0680.
The previous day high was 87.68 while the previous day low was 86.83. The daily 38.2% Fib levels comes at 87.15, expected to provide resistance. Similarly, the daily 61.8% fib level is at 87.36, expected to provide resistance.
In Monday’s session, the NZD/JPY closed with gains above the 87.000 level, but indicators on the daily chart suggest that the bears still have the upperhand.
In line with that, a neutral to bearish technical stance is seen for the cross in the daily chart, with the bears seeming to have taken a break after pushing down the pair by nearly 2.75% during October. The Relative Strength Index (RSI) lies flat in negative territory, while the Moving Average Convergence (MACD) displays flat red bars. That being said, the cross is still above the 200-day Simple Moving Average (SMA), suggesting that despite the recent bearish sentiment,the bulls are still resilient, holding some momentum and that sellers must increase their efforts to confirm a bearish short-term trend.
The same tendency is seen in the four-hour chart, which indicators lying flat in negative territory but with a clear downwards trend in the last sessions.
Support levels: 87.000, 86.505, 86.300.
Resistance levels: 87.620 (100-day SMA), 87.805, 88.110 (20-day SMA).
Technical Levels: Supports and Resistances
NZDJPY currently trading at 87.12 at the time of writing. Pair opened at 86.94 and is trading with a change of 0.21 % .
| Overview | Overview.1 | |
|---|---|---|
| 0 | Today last price | 87.12 |
| 1 | Today Daily Change | 0.18 |
| 2 | Today Daily Change % | 0.21 |
| 3 | Today daily open | 86.94 |
The pair is trading below its 20 Daily moving average @ 88.28, below its 50 Daily moving average @ 87.72 , below its 100 Daily moving average @ 87.62 and above its 200 Daily moving average @ 85.72
| Trends | Trends.1 | |
|---|---|---|
| 0 | Daily SMA20 | 88.28 |
| 1 | Daily SMA50 | 87.72 |
| 2 | Daily SMA100 | 87.62 |
| 3 | Daily SMA200 | 85.72 |
The previous day high was 87.68 while the previous day low was 86.83. The daily 38.2% Fib levels comes at 87.15, expected to provide resistance. Similarly, the daily 61.8% fib level is at 87.36, expected to provide resistance.
Note the levels of interest below:
- Pivot support is noted at 86.62, 86.3, 85.77
- Pivot resistance is noted at 87.48, 88.01, 88.33
| Levels | Levels.1 |
|---|---|
| Previous Daily High | 87.68 |
| Previous Daily Low | 86.83 |
| Previous Weekly High | 87.95 |
| Previous Weekly Low | 86.78 |
| Previous Monthly High | 90.21 |
| Previous Monthly Low | 86.30 |
| Daily Fibonacci 38.2% | 87.15 |
| Daily Fibonacci 61.8% | 87.36 |
| Daily Pivot Point S1 | 86.62 |
| Daily Pivot Point S2 | 86.30 |
| Daily Pivot Point S3 | 85.77 |
| Daily Pivot Point R1 | 87.48 |
| Daily Pivot Point R2 | 88.01 |
| Daily Pivot Point R3 | 88.33 |
[/s2If]
Download Nehcap EAWe have two EAs that are operational on our LIVE accounts.
- EA-FIX: Check out the details here. Download EA-FIX . EA-FIX is a non-grid HFT scalper.
- EA-GROWTH: High quality low dd EA using trend grids. Download EA_GROWTHJoin Our Telegram Group
")


