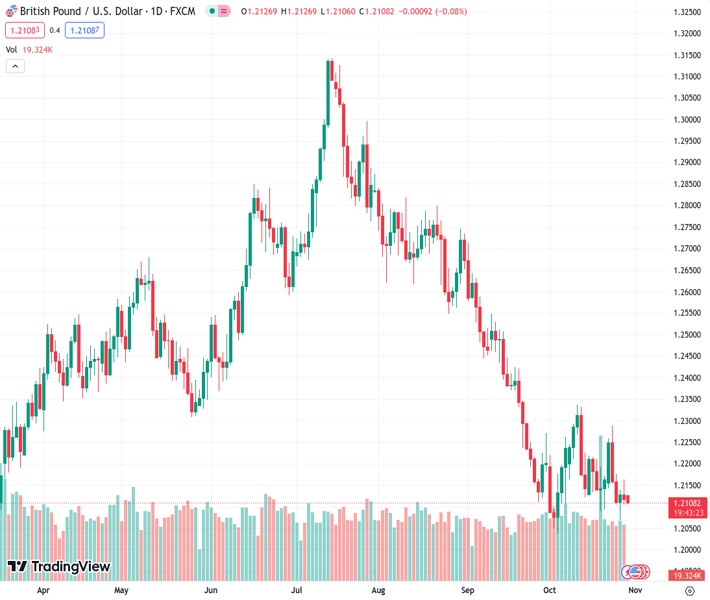
#GBPUSD @ 1.21091 extends its subdued range-bound price action during the Asian session on Monday.
…
This is a premium post.
[s2If !current_user_can(access_s2member_level4)]Please register for FREE REGISTER to read full post below containing analysis. In case of any error or you think you are not able to read the full post below, please email us at support#nehcap.com [lwa][/s2If] [s2If current_user_can(access_s2member_level1)]
- GBP/USD extends its subdued range-bound price action during the Asian session on Monday.
The pair currently trades last at 1.21091.
The previous day high was 1.2163 while the previous day low was 1.2106. The daily 38.2% Fib levels comes at 1.2128, expected to provide resistance. Similarly, the daily 61.8% fib level is at 1.2141, expected to provide resistance.
The GBP/USD pair continues with its struggle to gain any meaningful traction and oscillates in a multi-day-old trading range, around the 1.2100 mark during the Asian session on Monday. Traders now seem reluctant and prefer to wait on the sidelines ahead of this week’s key central bank event risks – the highly-anticipated FOMC decision on Wednesday, followed by the Bank of England (BoE) meeting on Thursday.
The Federal Reserve (Fed) is expected to maintain the status quo and leave interest rates unchanged for the second straight time in November, though the markets are still pricing in some chance of a rate hike later this year. The bets were reaffirmed by the relatively upbeat US macro data released recently, which pointed to a still-resilient economy. Adding to this, the stronger-than-expected increase in spending reported by the Commerce Department on Friday and elevated monthly inflation readings should allow the Fed to stick to its hawkish stance. The outlook remains supportive of elevated US Treasury bond yields, which continue to act as a tailwind for the US Dollar (USD) and weigh on the GBP/USD pair.
The Bank of England (BoE), on the other hand, is also anticipated to keep its benchmark interest rates on hold at a 15-year high of 5.25% on the back of growing worries about a recession. The UK central bank, however, is unlikely to relax its stance in the fight against high inflation rate and might keep the door open to further tightening. The uncertainty, in turn, is holding back traders from placing aggressive directional bets around the British Pound (GBP) and contributing to the GBP/USD pair’s range-bound price action. The lack of any buying, meanwhile, suggests that the path of least resistance for spot prices remains to the downside. Bears, however, need to wait for acceptance below the 1.2100 mark before placing fresh bets.
Moving ahead, there isn’t any relevant market-moving economic data due for release on Monday, either from the UK or the US. Hence, the US bond yields will continue to play a key role in influencing the USD price dynamics and produce short-term trading opportunities around the GBP/USD pair. Apart from this, traders will further take cues from the broader risk sentiment, which tends to drive demand for the safe-haven Greenback. The aforementioned fundamental backdrop, however, warrants some caution before placing fresh directional bets.
Technical Levels: Supports and Resistances
GBPUSD currently trading at 1.2111 at the time of writing. Pair opened at 1.2121 and is trading with a change of -0.08 % .
| Overview | Overview.1 | |
|---|---|---|
| 0 | Today last price | 1.2111 |
| 1 | Today Daily Change | -0.0010 |
| 2 | Today Daily Change % | -0.0800 |
| 3 | Today daily open | 1.2121 |
The pair remains strongly bearish on the daily time frame. It trades below the 20 SMA @ 1.2175, 50 SMA 1.2352, 100 SMA @ 1.257 and 200 SMA @ 1.2439.
| Trends | Trends.1 | |
|---|---|---|
| 0 | Daily SMA20 | 1.2175 |
| 1 | Daily SMA50 | 1.2352 |
| 2 | Daily SMA100 | 1.2570 |
| 3 | Daily SMA200 | 1.2439 |
The previous day high was 1.2163 while the previous day low was 1.2106. The daily 38.2% Fib levels comes at 1.2128, expected to provide resistance. Similarly, the daily 61.8% fib level is at 1.2141, expected to provide resistance.
Note the levels of interest below:
- Pivot support is noted at 1.2097, 1.2073, 1.204
- Pivot resistance is noted at 1.2154, 1.2187, 1.2211
| Levels | Levels.1 |
|---|---|
| Previous Daily High | 1.2163 |
| Previous Daily Low | 1.2106 |
| Previous Weekly High | 1.2289 |
| Previous Weekly Low | 1.2070 |
| Previous Monthly High | 1.2713 |
| Previous Monthly Low | 1.2111 |
| Daily Fibonacci 38.2% | 1.2128 |
| Daily Fibonacci 61.8% | 1.2141 |
| Daily Pivot Point S1 | 1.2097 |
| Daily Pivot Point S2 | 1.2073 |
| Daily Pivot Point S3 | 1.2040 |
| Daily Pivot Point R1 | 1.2154 |
| Daily Pivot Point R2 | 1.2187 |
| Daily Pivot Point R3 | 1.2211 |
[/s2If]
Download Nehcap EAWe have two EAs that are operational on our LIVE accounts.
- EA-FIX: Check out the details here. Download EA-FIX . EA-FIX is a non-grid HFT scalper.
- EA-GROWTH: High quality low dd EA using trend grids. Download EA_GROWTHJoin Our Telegram Group
")


