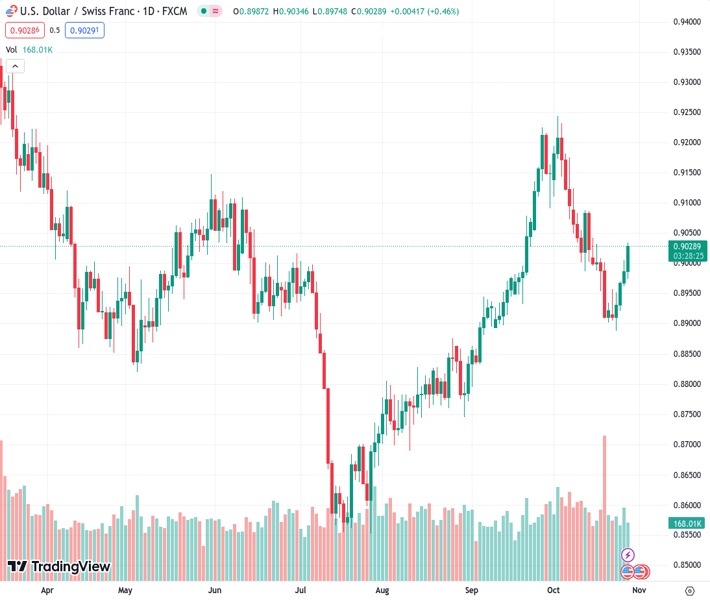
#USDCHF @ 0.90288 The rose to a two-week high around 0.9035 near the 20-day SMA.
…
This is a premium post.
[s2If !current_user_can(access_s2member_level4)]Please register for FREE REGISTER to read full post below containing analysis. In case of any error or you think you are not able to read the full post below, please email us at support#nehcap.com [lwa][/s2If] [s2If current_user_can(access_s2member_level1)]
- The USD/CHF rose to a two-week high around 0.9035 near the 20-day SMA.
The pair currently trades last at 0.90288.
The previous day high was 0.9005 while the previous day low was 0.8962. The daily 38.2% Fib levels comes at 0.8988, expected to provide support. Similarly, the daily 61.8% fib level is at 0.8978, expected to provide support.
At the end of the week, the USD/CHF rose for a fourth consecutive day, near 0.9035, piercing through the 200-day Simple Moving Average (SMA) but then getting rejected by the 20-day average. The pair’s trajectory seems to be the CHF’s weakness, which trades with losses against the USD, EUR,GBP and JPY in Friday’s sessions and was one of the weakest currencies in the session.
On the other hand, the US Dollar is also trading soft after key inflation data reported earlier in the session. The U.S. Bureau of Economic Analysis revealed that the Core Personal Consumption Expenditures (PCE) Price Index, the Fed’s preferred gauge of inflation, from September, aligned with the consensus. The figure came in at 3.7% YoY, vs. the consensus of 3.7% and decelerated from its previous figure of 3.8%. In addition, The headline PCE Price Index from September came in at 3.4% YoY, vs the expected 3.4% and remained steady regarding its previous figure of 3.4%.
Other data reported strong Consumer Sentiment figures released by the University of Michigan (UoM), which came in at 68.3 vs 68. The 5-year inflation expectations from the same university figures didn’t reveal any surprise and stood at 3%.
Elsewhere, the US government bond yields are seen neutral, with some rates rising and others declining. The 2-year rate stands at 5.03%, while the 5 and 10-year yields are at 4.79% and 4.87%, respectively. In addition, dovish bets on the Federal Reserve (Fed) are still high, and the CME Fed Watch tool indicates that a pause in the next week’s meeting is practically priced in while the odds of a hike in December retreated to 20%. In that sense, the combination of lower US yields and dovish bets on the Fed may limit the upward trajectory of the pair.
Based on the daily chart, the technical outlook for USD/CHF remains neutral to bullish as the bulls recovered a significant amount of ground during the week. The Relative Strength Index (RSI) jumped above the 50 middle point, while the Moving Average Convergence (MACD) exhibited decreasing red bars.
On the other hand, the pair is below the 20-day Simple Moving Average (SMA), but above the 100 and 200-day SMAs, highlighting the continued dominance of bulls in the broader outlook. However, if the bulls want to continue climbing higher, the 20-day average must be conquered.
Support levels: 0.9000 (200-day SMA), 0.8990, 0.8950.
Resistance levels: 0.9035 (20-day SMA), 0.9050, 0.9070.
Technical Levels: Supports and Resistances
USDCHF currently trading at 0.9033 at the time of writing. Pair opened at 0.8988 and is trading with a change of 0.5 % .
| Overview | Overview.1 | |
|---|---|---|
| 0 | Today last price | 0.9033 |
| 1 | Today Daily Change | 0.0045 |
| 2 | Today Daily Change % | 0.5000 |
| 3 | Today daily open | 0.8988 |
The pair is trading below its 20 Daily moving average @ 0.904, above its 50 Daily moving average @ 0.8973 , above its 100 Daily moving average @ 0.8897 and above its 200 Daily moving average @ 0.9009
| Trends | Trends.1 | |
|---|---|---|
| 0 | Daily SMA20 | 0.9040 |
| 1 | Daily SMA50 | 0.8973 |
| 2 | Daily SMA100 | 0.8897 |
| 3 | Daily SMA200 | 0.9009 |
The previous day high was 0.9005 while the previous day low was 0.8962. The daily 38.2% Fib levels comes at 0.8988, expected to provide support. Similarly, the daily 61.8% fib level is at 0.8978, expected to provide support.
Note the levels of interest below:
- Pivot support is noted at 0.8966, 0.8943, 0.8923
- Pivot resistance is noted at 0.9008, 0.9027, 0.905
| Levels | Levels.1 |
|---|---|
| Previous Daily High | 0.9005 |
| Previous Daily Low | 0.8962 |
| Previous Weekly High | 0.9042 |
| Previous Weekly Low | 0.8902 |
| Previous Monthly High | 0.9225 |
| Previous Monthly Low | 0.8795 |
| Daily Fibonacci 38.2% | 0.8988 |
| Daily Fibonacci 61.8% | 0.8978 |
| Daily Pivot Point S1 | 0.8966 |
| Daily Pivot Point S2 | 0.8943 |
| Daily Pivot Point S3 | 0.8923 |
| Daily Pivot Point R1 | 0.9008 |
| Daily Pivot Point R2 | 0.9027 |
| Daily Pivot Point R3 | 0.9050 |
[/s2If]
Download Nehcap EAWe have two EAs that are operational on our LIVE accounts.
- EA-FIX: Check out the details here. Download EA-FIX . EA-FIX is a non-grid HFT scalper.
- EA-GROWTH: High quality low dd EA using trend grids. Download EA_GROWTHJoin Our Telegram Group
")


