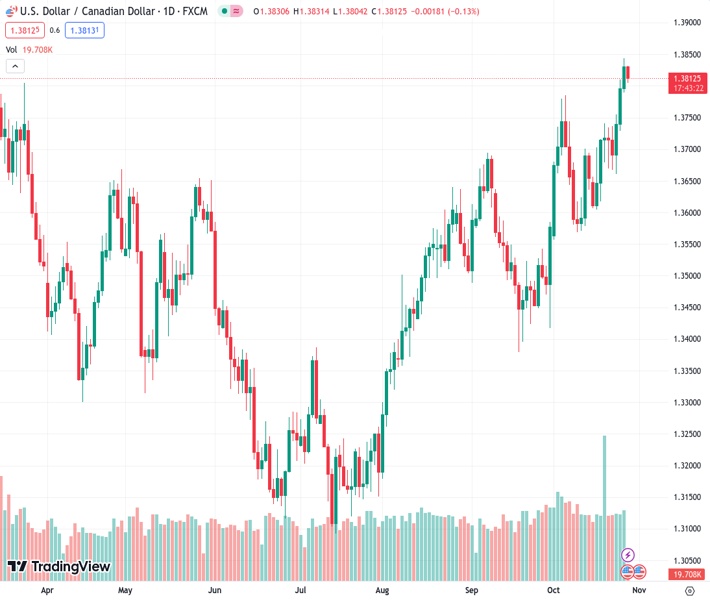
#USDCAD @ 1.38127 meets with some supply on Friday and is weighed down by a combination of factors.
…
This is a premium post.
[s2If !current_user_can(access_s2member_level4)]Please register for FREE REGISTER to read full post below containing analysis. In case of any error or you think you are not able to read the full post below, please email us at support#nehcap.com [lwa][/s2If] [s2If current_user_can(access_s2member_level1)]
- USD/CAD meets with some supply on Friday and is weighed down by a combination of factors.
The pair currently trades last at 1.38127.
The previous day high was 1.3844 while the previous day low was 1.379. The daily 38.2% Fib levels comes at 1.3823, expected to provide resistance. Similarly, the daily 61.8% fib level is at 1.3811, expected to provide support.
The USD/CAD pair comes under some selling pressure during the Asian session on Friday and for now, seems to have snapped a three-day winning streak to a multi-month top, around the 1.3840-1.3845 area touched the previous day. Spot prices currently trade around the 1.3805-1.3810 region, down over 0.15% for the day, though any meaningful corrective slide seems elusive.
A modest uptick in Crude Oil prices is seen underpinning the commodity-linked Loonie and weighing on the USD/CAD pair amid subdued US Dollar (USD) price action. The upside for Oil prices, however, seems limited in the wake of receding fears that the Israle-Hamas war could spill over to other Middle Eastern countries and disrupt global supplies. Adding to this, a string of weak economic data from the Euro Zone this week raised concerns about fuel demand and might further contribute to capping the black liquid.
Furthermore, expectations that the Federal Reserve (Fed) will keep interest rates higher for longer act as a tailwind for the USD and might further contribute to limiting losses for the USD/CAD pair. The Advance US GDP report released on Thursday showed that the economy grew at a faster-than-expected pace during the third quarter. Adding to this, the US Durable Goods Orders also surpassed consensus estimates and pointed to a still resilient US economy, which should allow the Fed to stick to its hawkish stance.
This, in turn, remains supportive of elevated US Treasury bond yields and might continue to act as a tailwind for the Greenback. The markets, however, seem convinced that the Fed will maintain the status quo next week amid signs of easing inflationary pressures, which is holding back the USD bulls from placing fresh bets and doing little to lend any support to the USD/CAD pair. Moving ahead, Friday’s key focus will remain glued to the release of the US Core PCE Price Index – the Fed’s preferred inflation gauge.
The crucial report will play a key role in influencing market expectations about the Fed’s future rate-hike path, which, in turn, will drive the USD demand and provide a fresh impetus to the USD/CAD pair. Apart from this, traders will take cues from Oil price dynamics to grab short-term opportunities. Nevertheless, spot prices remain on track to register gains for the second straight week – also the fourth in the previous five – as the attention now turns to the highly anticipated FOMC policy meeting next week.
Technical Levels: Supports and Resistances
USDCAD currently trading at 1.3808 at the time of writing. Pair opened at 1.3831 and is trading with a change of -0.17 % .
| Overview | Overview.1 | |
|---|---|---|
| 0 | Today last price | 1.3808 |
| 1 | Today Daily Change | -0.0023 |
| 2 | Today Daily Change % | -0.1700 |
| 3 | Today daily open | 1.3831 |
The pair remains strongly bullish on the daily timeframe. It trades above its 20 SMA @ 1.3683, 50 SMA 1.36, 100 SMA @ 1.3439 and 200 SMA @ 1.3477.
| Trends | Trends.1 | |
|---|---|---|
| 0 | Daily SMA20 | 1.3683 |
| 1 | Daily SMA50 | 1.3600 |
| 2 | Daily SMA100 | 1.3439 |
| 3 | Daily SMA200 | 1.3477 |
The previous day high was 1.3844 while the previous day low was 1.379. The daily 38.2% Fib levels comes at 1.3823, expected to provide resistance. Similarly, the daily 61.8% fib level is at 1.3811, expected to provide support.
Note the levels of interest below:
- Pivot support is noted at 1.3799, 1.3768, 1.3745
- Pivot resistance is noted at 1.3853, 1.3876, 1.3907
| Levels | Levels.1 |
|---|---|
| Previous Daily High | 1.3844 |
| Previous Daily Low | 1.3790 |
| Previous Weekly High | 1.3741 |
| Previous Weekly Low | 1.3606 |
| Previous Monthly High | 1.3694 |
| Previous Monthly Low | 1.3379 |
| Daily Fibonacci 38.2% | 1.3823 |
| Daily Fibonacci 61.8% | 1.3811 |
| Daily Pivot Point S1 | 1.3799 |
| Daily Pivot Point S2 | 1.3768 |
| Daily Pivot Point S3 | 1.3745 |
| Daily Pivot Point R1 | 1.3853 |
| Daily Pivot Point R2 | 1.3876 |
| Daily Pivot Point R3 | 1.3907 |
[/s2If]
Download Nehcap EAWe have two EAs that are operational on our LIVE accounts.
- EA-FIX: Check out the details here. Download EA-FIX . EA-FIX is a non-grid HFT scalper.
- EA-GROWTH: High quality low dd EA using trend grids. Download EA_GROWTHJoin Our Telegram Group
")


