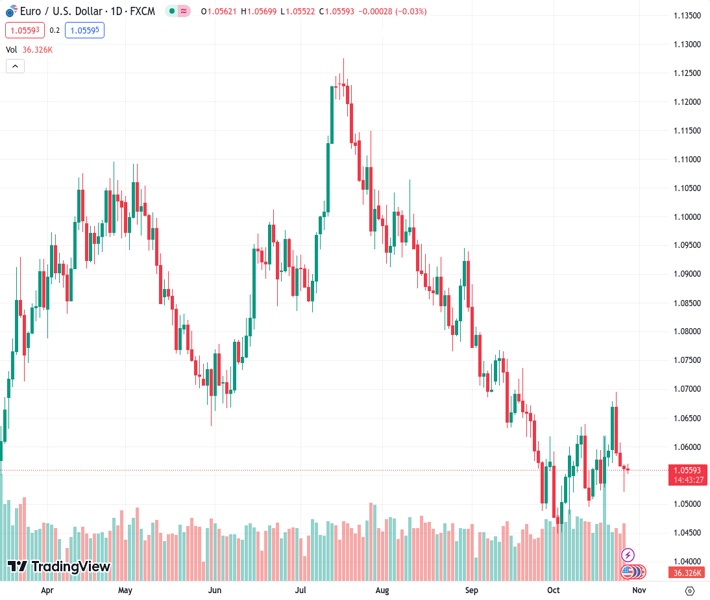
#EURUSD @ 1.05612 hovers around 1.0565 amid the USD weakness, lower US bond yield.
…
This is a premium post.
[s2If !current_user_can(access_s2member_level4)]Please register for FREE REGISTER to read full post below containing analysis. In case of any error or you think you are not able to read the full post below, please email us at support#nehcap.com [lwa][/s2If] [s2If current_user_can(access_s2member_level1)]
- EUR/USD hovers around 1.0565 amid the USD weakness, lower US bond yield.
The pair currently trades last at 1.05612.
The previous day high was 1.0574 while the previous day low was 1.0522. The daily 38.2% Fib levels comes at 1.0542, expected to provide support. Similarly, the daily 61.8% fib level is at 1.0554, expected to provide support.
The EUR/USD pair recovers some lost ground above the mid-1.0500s during the early European session on Friday. The lower US Treasury bond yields drag the US Dollar (USD) lower, which acts as a tailwind for the EUR/USD pair.
On Thursday, the European Central Bank (ECB) decided to leave interest rates unchanged as widely expected. ECB President Christine Lagard said that the fact that the central bank holds rates doesn’t mean that they will never hike again. Lagarde further stated that the risks to economic growth remain tilted to the downside.
According to the four-hour chart, the EUR/USD pair holds below the 100- and 200-hour Exponential Moving Averages (EMAs), suggesting the path of least resistance is to the downside. It’s worth noting that the Relative Strength Index (RSI) is located in bearish territory under 50, which supports the sellers in the near term.
The first upside barrier for the major pair is located near the 100-EMA at 1.0580. Any follow-through buying above the upper boundary of Bollinger Band of 1.0660 will see the rally to 1.0694 (high of October 24), followed by 1.0735 (high of September 20).
On the other hand, 1.0522 acts as the initial support level for EUR/USD. The key contention level is seen at the 1.0500-1.0505 region, portraying the confluence of the lower limit of the Bollinger Band and a psychological round figure. A decisive break below the latter will see a drop to 1.0450 (a low of October 4).
Technical Levels: Supports and Resistances
EURUSD currently trading at 1.0569 at the time of writing. Pair opened at 1.0563 and is trading with a change of 0.06 % .
| Overview | Overview.1 | |
|---|---|---|
| 0 | Today last price | 1.0569 |
| 1 | Today Daily Change | 0.0006 |
| 2 | Today Daily Change % | 0.0600 |
| 3 | Today daily open | 1.0563 |
The pair is trading above its 20 Daily moving average @ 1.0561, below its 50 Daily moving average @ 1.0666 , below its 100 Daily moving average @ 1.0821 and below its 200 Daily moving average @ 1.0815
| Trends | Trends.1 | |
|---|---|---|
| 0 | Daily SMA20 | 1.0561 |
| 1 | Daily SMA50 | 1.0666 |
| 2 | Daily SMA100 | 1.0821 |
| 3 | Daily SMA200 | 1.0815 |
The previous day high was 1.0574 while the previous day low was 1.0522. The daily 38.2% Fib levels comes at 1.0542, expected to provide support. Similarly, the daily 61.8% fib level is at 1.0554, expected to provide support.
Note the levels of interest below:
- Pivot support is noted at 1.0532, 1.0501, 1.048
- Pivot resistance is noted at 1.0584, 1.0605, 1.0636
| Levels | Levels.1 |
|---|---|
| Previous Daily High | 1.0574 |
| Previous Daily Low | 1.0522 |
| Previous Weekly High | 1.0617 |
| Previous Weekly Low | 1.0511 |
| Previous Monthly High | 1.0882 |
| Previous Monthly Low | 1.0488 |
| Daily Fibonacci 38.2% | 1.0542 |
| Daily Fibonacci 61.8% | 1.0554 |
| Daily Pivot Point S1 | 1.0532 |
| Daily Pivot Point S2 | 1.0501 |
| Daily Pivot Point S3 | 1.0480 |
| Daily Pivot Point R1 | 1.0584 |
| Daily Pivot Point R2 | 1.0605 |
| Daily Pivot Point R3 | 1.0636 |
[/s2If]
Download Nehcap EAWe have two EAs that are operational on our LIVE accounts.
- EA-FIX: Check out the details here. Download EA-FIX . EA-FIX is a non-grid HFT scalper.
- EA-GROWTH: High quality low dd EA using trend grids. Download EA_GROWTHJoin Our Telegram Group
")


