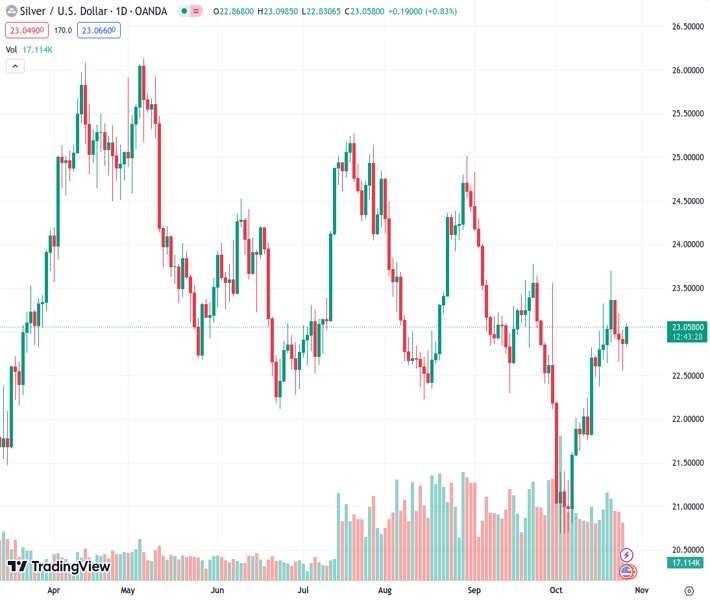
#XAGUSD @ 23.050 Silver attracts fresh buyers on Thursday and snaps a three-day losing streak to over a one-week low.
…
This is a premium post.
[s2If !current_user_can(access_s2member_level4)]Please register for FREE REGISTER to read full post below containing analysis. In case of any error or you think you are not able to read the full post below, please email us at support#nehcap.com [lwa][/s2If] [s2If current_user_can(access_s2member_level1)]
- Silver attracts fresh buyers on Thursday and snaps a three-day losing streak to over a one-week low.
The pair currently trades last at 23.050.
The previous day high was 23.02 while the previous day low was 22.56. The daily 38.2% Fib levels comes at 22.73, expected to provide support. Similarly, the daily 61.8% fib level is at 22.84, expected to provide support.
Silver (XAG/USD) builds on the previous day’s bounce from the vicinity of mid-$22.00s, or over a one-week low and scales higher through the early part of the European session on Thursday. The white metal, for now, seems to have snapped a three-day losing streak and currently trades around the $23.00 round figure, up nearly 1% for the day.
From a technical perspective, the XAG/USD has been showing some resilience below the 38.2% Fibonacci retracement level of the May-October slide. Moreover, oscillators on the daily chart are holding in the positive territory and support prospects for a further appreciating move. That said, any subsequent move up is more likely to confront stiff resistance near the $23.30-$23.40 confluence, comprising the 50% Fibo. level, the 100-day and 200-day Simple Moving Averages (SMAs).
This is followed by the $23.70-$23.75 strong horizontal barrier, above which a bout of a short-covering move could lift the XAG/USD towards the $24.00 mark, which coincides with the 61.8% Fibo. level. Some follow-through buying will expose a descending trend-line hurdle extending from the May high, currently pegged around the $24.20 region. A convincing breakout through the latter will be seen as a fresh trigger for bullish traders and set the stage for some meaningful upside.
On the flip side, the 38.2% Fibo. level, around the $22.75 area, now seems to protect the immediate downside ahead of the overnight swing low, near the $22.55 zone. Failure to defend the said support levels might prompt some technical selling and drag the XAG/USD to the $22.30-$22.25 horizontal resistance breakpoint now turned support. The downward trajectory could get extended further towards the $22.00 round-figure mark, representing 23.6% Fibo. level.
Technical Levels: Supports and Resistances
XAGUSD currently trading at 23.07 at the time of writing. Pair opened at 22.86 and is trading with a change of 0.92 % .
| Overview | Overview.1 | |
|---|---|---|
| 0 | Today last price | 23.07 |
| 1 | Today Daily Change | 0.21 |
| 2 | Today Daily Change % | 0.92 |
| 3 | Today daily open | 22.86 |
The pair is trading above its 20 Daily moving average @ 22.22, above its 50 Daily moving average @ 22.96 , below its 100 Daily moving average @ 23.28 and below its 200 Daily moving average @ 23.31
| Trends | Trends.1 | |
|---|---|---|
| 0 | Daily SMA20 | 22.22 |
| 1 | Daily SMA50 | 22.96 |
| 2 | Daily SMA100 | 23.28 |
| 3 | Daily SMA200 | 23.31 |
The previous day high was 23.02 while the previous day low was 22.56. The daily 38.2% Fib levels comes at 22.73, expected to provide support. Similarly, the daily 61.8% fib level is at 22.84, expected to provide support.
Note the levels of interest below:
- Pivot support is noted at 22.6, 22.35, 22.14
- Pivot resistance is noted at 23.07, 23.28, 23.54
| Levels | Levels.1 |
|---|---|
| Previous Daily High | 23.02 |
| Previous Daily Low | 22.56 |
| Previous Weekly High | 23.70 |
| Previous Weekly Low | 22.37 |
| Previous Monthly High | 24.82 |
| Previous Monthly Low | 22.12 |
| Daily Fibonacci 38.2% | 22.73 |
| Daily Fibonacci 61.8% | 22.84 |
| Daily Pivot Point S1 | 22.60 |
| Daily Pivot Point S2 | 22.35 |
| Daily Pivot Point S3 | 22.14 |
| Daily Pivot Point R1 | 23.07 |
| Daily Pivot Point R2 | 23.28 |
| Daily Pivot Point R3 | 23.54 |
[/s2If]
Download Nehcap EAWe have two EAs that are operational on our LIVE accounts.
- EA-FIX: Check out the details here. Download EA-FIX . EA-FIX is a non-grid HFT scalper.
- EA-GROWTH: High quality low dd EA using trend grids. Download EA_GROWTHJoin Our Telegram Group
")


