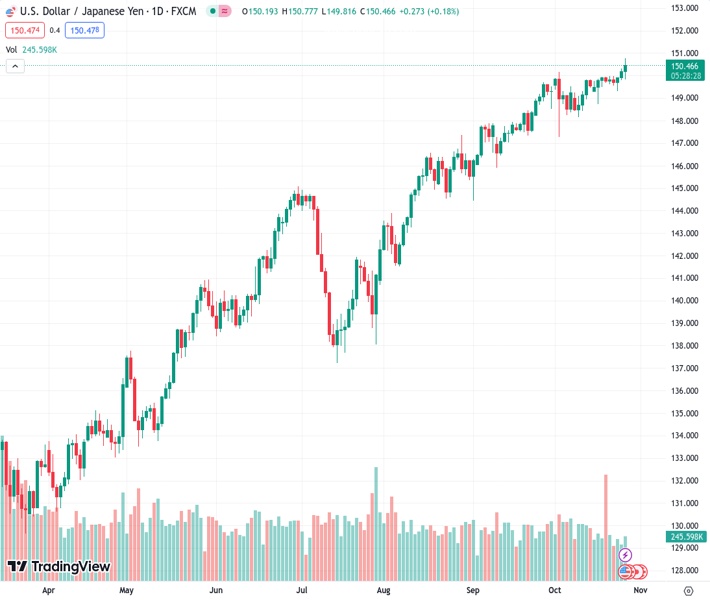
#USDJPY @ 150.474 rose to a high of around 150.77, it highest level since late October 2022.
…
This is a premium post.
[s2If !current_user_can(access_s2member_level4)]Please register for FREE REGISTER to read full post below containing analysis. In case of any error or you think you are not able to read the full post below, please email us at support#nehcap.com [lwa][/s2If] [s2If current_user_can(access_s2member_level1)]
- USD/JPY rose to a high of around 150.77, it highest level since late October 2022.
The pair currently trades last at 150.474.
The previous day high was 150.32 while the previous day low was 149.79. The daily 38.2% Fib levels comes at 150.12, expected to provide support. Similarly, the daily 61.8% fib level is at 150.0, expected to provide support.
In Thursday’s session, the USD/JPY continued gaining ground, rising to a high of around 150.77 and then settling at 150.35. The US Dollar is trading strong against its rivals, with the DXY index rising to monthly highs and keeping its momentum despite the US Treasury yields retreating. Despite robust economic activity data, markets continue to bet on higher odds of the Federal Reserve not hiking again in 2023.
On the data front, the Gross Domestic Product (GDP) preliminary estimate from Q3 grew at an annualised rate of 4.9%, higher than the expected 4.3% and increased in relation to its last reading of 2.1%. In addition, Durable Goods Orders from September rose by 4.7% MoM in September, way higher than the 1.5% expected. On the negative front, Jobless Claims from the week ending on October 21 came in at 210,000, above the expected 208,000 and increased in relation to its last reading of 200,000.
Meanwhile, the US bond yields are falling. The 2-year rate declined to 5.05% while the longer-term 5 and 10-year rates fell towards 4.84% and 4.90%, limiting the USD upward trajectory. In line with that, according to the CME FedWatch Tool, the odds of a 25 basis points hike in December declined to 20%, and it also suggests that a pause in November is nearly priced in. As long as investors refrain from placing bets on one more hike by the Fed, the upward momentum of the USD/JPY will be limited and as the speculation of a policy tweak of the Bank of Japan (BoJ) accompanied by rising Japanese Government yields, the pair could face some downwards pressure.
Focus now shifts to Friday’s Consumption Expenditures (PCE) figures from the US from September, whose outcome could affect the expectations on the next Fed’s decisions.
The USD/JPY daily chart signals a bullish sentiment for the short term. The Relative Strength Index (RSI) is favourably positioned in positive territory above its midline, reflecting an upward movement. Similarly, Moving Average Convergence Divergence (MACD) depicts green bars, affirming the bullish momentum. Additionally, the pair is above the 20,100,200-day Simple Moving Average (SMAs), indicating that the buyers are commanding the broader perspective.
Support levels: 150.00, 149.50, 148.00.
Resistance levels: 150.50, 150.70, 151.00
Technical Levels: Supports and Resistances
USDJPY currently trading at 150.39 at the time of writing. Pair opened at 150.22 and is trading with a change of 0.11 % .
| Overview | Overview.1 | |
|---|---|---|
| 0 | Today last price | 150.39 |
| 1 | Today Daily Change | 0.17 |
| 2 | Today Daily Change % | 0.11 |
| 3 | Today daily open | 150.22 |
The pair remains strongly bullish on the daily timeframe. It trades above its 20 SMA @ 149.45, 50 SMA 148.02, 100 SMA @ 145.04 and 200 SMA @ 139.67.
| Trends | Trends.1 | |
|---|---|---|
| 0 | Daily SMA20 | 149.45 |
| 1 | Daily SMA50 | 148.02 |
| 2 | Daily SMA100 | 145.04 |
| 3 | Daily SMA200 | 139.67 |
The previous day high was 150.32 while the previous day low was 149.79. The daily 38.2% Fib levels comes at 150.12, expected to provide support. Similarly, the daily 61.8% fib level is at 150.0, expected to provide support.
Note the levels of interest below:
- Pivot support is noted at 149.9, 149.59, 149.38
- Pivot resistance is noted at 150.42, 150.63, 150.95
| Levels | Levels.1 |
|---|---|
| Previous Daily High | 150.32 |
| Previous Daily Low | 149.79 |
| Previous Weekly High | 149.99 |
| Previous Weekly Low | 148.76 |
| Previous Monthly High | 149.71 |
| Previous Monthly Low | 144.44 |
| Daily Fibonacci 38.2% | 150.12 |
| Daily Fibonacci 61.8% | 150.00 |
| Daily Pivot Point S1 | 149.90 |
| Daily Pivot Point S2 | 149.59 |
| Daily Pivot Point S3 | 149.38 |
| Daily Pivot Point R1 | 150.42 |
| Daily Pivot Point R2 | 150.63 |
| Daily Pivot Point R3 | 150.95 |
[/s2If]
Download Nehcap EAWe have two EAs that are operational on our LIVE accounts.
- EA-FIX: Check out the details here. Download EA-FIX . EA-FIX is a non-grid HFT scalper.
- EA-GROWTH: High quality low dd EA using trend grids. Download EA_GROWTHJoin Our Telegram Group
")


