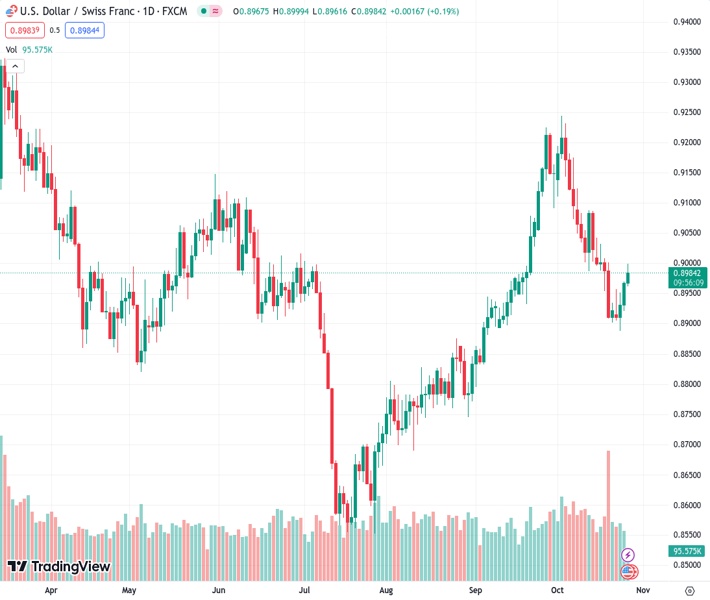
#USDCHF @ 0.89857 finds offers near 0.9000 as focus shifts to US GDP data.
…
This is a premium post.
[s2If !current_user_can(access_s2member_level4)]Please register for FREE REGISTER to read full post below containing analysis. In case of any error or you think you are not able to read the full post below, please email us at support#nehcap.com [lwa][/s2If] [s2If current_user_can(access_s2member_level1)]
- USD/CHF finds offers near 0.9000 as focus shifts to US GDP data.
The pair currently trades last at 0.89857.
The previous day high was 0.8969 while the previous day low was 0.8921. The daily 38.2% Fib levels comes at 0.8951, expected to provide support. Similarly, the daily 61.8% fib level is at 0.8939, expected to provide support.
The USD/CHF pair faced some selling pressure after printing a four-day high near the psychological resistance of 0.9000 in the European session. The Swiss Franc asset corrected gradually as the US Dollar struggled for upside ahead of the US Q3 Gross Domestic Product (GDP) data, which will be published at 12:30 GMT.
Analysts at Wells Fargo have forecasted the real GDP to expand at a 5.0% annualized rate in Q3. If realized, economic growth will be up 3.0% on a YoY basis, roughly half a percentage point ahead of its pre-pandemic average.
The upbeat GDP report would also impact the decision-making of Federal Reserve (Fed) policymakers for the monetary policy meeting scheduled for November 1. It is widely anticipated that the Fed will keep interest rates unchanged in the range of 5.25-5.50% due to higher long-term bond yields.
This week, the Swiss Franc remained under pressure amid weak ZEW Expectations-Survey data. The sentiment indicator showed that business and employment conditions deteriorated further in October.
USD/CHF delivered a bullish reversal after a breakout of the Inverse Head and Shoulder chart pattern formed on an hourly scale. The Swiss franc asset has reached to near the horizontal resistance plotted from October 19 high plotted around 0.9000. Upward-sloping 20-period Exponential Moving Average (EMA) indicates that the near-term trend is bullish.
The Relative Strength Index (RSI) (14) trades in the bullish range of 60.00-80.00, which warrants more upside ahead.
A fresh upside would appear if the Swiss Franc asset delivers a confident break above the psychological resistance of 0.9000. This would drive the asset toward October 17 high at 0.9032, followed by October 10 high at 0.9083.
In an alternate scenario, a downside move below October 25 low at 0.8920 would expose the asset to October 24 low at 0.8888. Further breakdown below the latter would drag the asset toward September 5 low around 0.8830.
Technical Levels: Supports and Resistances
USDCHF currently trading at 0.8981 at the time of writing. Pair opened at 0.8968 and is trading with a change of 0.14 % .
| Overview | Overview.1 | |
|---|---|---|
| 0 | Today last price | 0.8981 |
| 1 | Today Daily Change | 0.0013 |
| 2 | Today Daily Change % | 0.1400 |
| 3 | Today daily open | 0.8968 |
The pair is trading below its 20 Daily moving average @ 0.9048, above its 50 Daily moving average @ 0.8969 , above its 100 Daily moving average @ 0.8897 and below its 200 Daily moving average @ 0.901
| Trends | Trends.1 | |
|---|---|---|
| 0 | Daily SMA20 | 0.9048 |
| 1 | Daily SMA50 | 0.8969 |
| 2 | Daily SMA100 | 0.8897 |
| 3 | Daily SMA200 | 0.9010 |
The previous day high was 0.8969 while the previous day low was 0.8921. The daily 38.2% Fib levels comes at 0.8951, expected to provide support. Similarly, the daily 61.8% fib level is at 0.8939, expected to provide support.
Note the levels of interest below:
- Pivot support is noted at 0.8936, 0.8904, 0.8888
- Pivot resistance is noted at 0.8985, 0.9001, 0.9033
| Levels | Levels.1 |
|---|---|
| Previous Daily High | 0.8969 |
| Previous Daily Low | 0.8921 |
| Previous Weekly High | 0.9042 |
| Previous Weekly Low | 0.8902 |
| Previous Monthly High | 0.9225 |
| Previous Monthly Low | 0.8795 |
| Daily Fibonacci 38.2% | 0.8951 |
| Daily Fibonacci 61.8% | 0.8939 |
| Daily Pivot Point S1 | 0.8936 |
| Daily Pivot Point S2 | 0.8904 |
| Daily Pivot Point S3 | 0.8888 |
| Daily Pivot Point R1 | 0.8985 |
| Daily Pivot Point R2 | 0.9001 |
| Daily Pivot Point R3 | 0.9033 |
[/s2If]
Download Nehcap EAWe have two EAs that are operational on our LIVE accounts.
- EA-FIX: Check out the details here. Download EA-FIX . EA-FIX is a non-grid HFT scalper.
- EA-GROWTH: High quality low dd EA using trend grids. Download EA_GROWTHJoin Our Telegram Group
")


