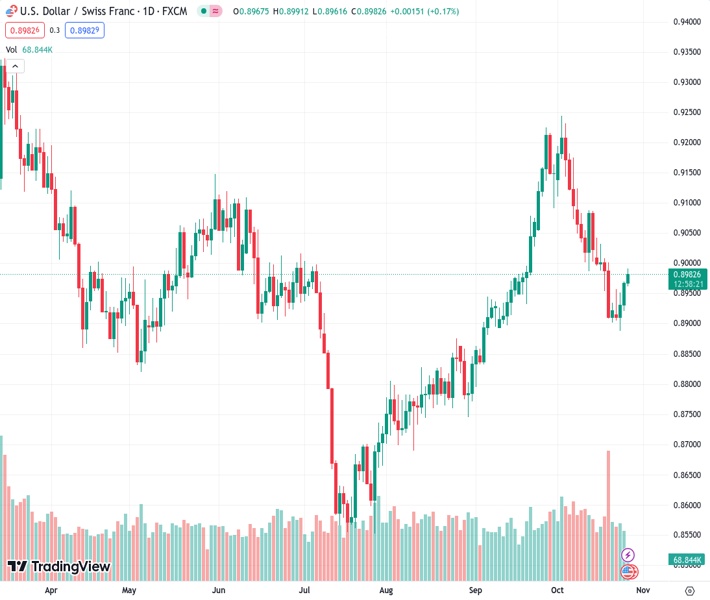
#USDCHF @ 0.89811 extends gains on the back of surging US Bond yields
…
This is a premium post.
[s2If !current_user_can(access_s2member_level4)]Please register for FREE REGISTER to read full post below containing analysis. In case of any error or you think you are not able to read the full post below, please email us at support#nehcap.com [lwa][/s2If] [s2If current_user_can(access_s2member_level1)]
- USD/CHF extends gains on the back of surging US Bond yields
The pair currently trades last at 0.89811.
The previous day high was 0.8969 while the previous day low was 0.8921. The daily 38.2% Fib levels comes at 0.8951, expected to provide support. Similarly, the daily 61.8% fib level is at 0.8939, expected to provide support.
USD/CHF moves upward for the third successive day, marking weekly highs around 0.8990 during the Asian session on Thursday. The US Dollar (USD) continues to gain value on the back of surging US Bond yields, which provides support to underpinning the USD/CHF pair.
Investors will likely observe the US Q3 Gross Domestic Product (GDP) figures and Core Personal Consumption Expenditures (PCE) on Thursday and Friday, respectively, which may provide a crucial snapshot of economic performance in the United States.
The US Dollar Index (DXY) extends its winning streak for the third consecutive day, hovering around 106.90 at the time of writing. The US Dollar receives support from the stronger US housing data and improved risk aversion.
US Census Bureau reported the New Home Sales for September on Wednesday, which have surpassed expectations significantly. The headline figure stands at 0.759 million, outperforming the consensus forecast of 0.68 million and marking an increase from the previous reading of 0.676 million. This positive deviation indicates a robust performance in the housing sector, potentially influencing market sentiment.
USD/CHF pair might encounter some resistance as expectations dwindle regarding another rate hike by the Federal Reserve (Fed) by the end of 2023. Investors followed recent diverse comments from Fed officials, including Chairman Jerome Powell’s assertion that the central bank currently has no intentions to raise interest rates.
The US Dollar (USD) rides high on the recent upswing in US Treasury yields, with aspirations to surpass the 5.0% mark. At present, the 10-year Treasury note is holding steady at 4.98%, contributing to the strengthened position of the USD.
Swiss Franc could be in for a turbulent journey, given the ZEW Survey Expectations on Wednesday. There is a decline in Switzerland’s business conditions and labor market, dropping from 27.6 to 37.8 in October.
Middle-East conflict initially supported the Swiss Franc (CHF) as risk sentiment faltered. However, the latest development appears to be steering investors towards the Greenback. Earlier on Thursday, Israeli Prime Minister Benjamin Netanyahu expressed readiness for a ground assault on Gaza. This has triggered a shift towards a risk-off sentiment, boosting strength for the pair.
Investors await fresh updates on further developments as Iran Foreign Minister Hossein Amir-Abdollahian travels to the US to discuss the Israel-Hamas conflict.
Technical Levels: Supports and Resistances
USDCHF currently trading at 0.8986 at the time of writing. Pair opened at 0.8968 and is trading with a change of 0.2 % .
| Overview | Overview.1 | |
|---|---|---|
| 0 | Today last price | 0.8986 |
| 1 | Today Daily Change | 0.0018 |
| 2 | Today Daily Change % | 0.2000 |
| 3 | Today daily open | 0.8968 |
The pair is trading below its 20 Daily moving average @ 0.9048, above its 50 Daily moving average @ 0.8969 , above its 100 Daily moving average @ 0.8897 and below its 200 Daily moving average @ 0.901
| Trends | Trends.1 | |
|---|---|---|
| 0 | Daily SMA20 | 0.9048 |
| 1 | Daily SMA50 | 0.8969 |
| 2 | Daily SMA100 | 0.8897 |
| 3 | Daily SMA200 | 0.9010 |
The previous day high was 0.8969 while the previous day low was 0.8921. The daily 38.2% Fib levels comes at 0.8951, expected to provide support. Similarly, the daily 61.8% fib level is at 0.8939, expected to provide support.
Note the levels of interest below:
- Pivot support is noted at 0.8936, 0.8904, 0.8888
- Pivot resistance is noted at 0.8985, 0.9001, 0.9033
| Levels | Levels.1 |
|---|---|
| Previous Daily High | 0.8969 |
| Previous Daily Low | 0.8921 |
| Previous Weekly High | 0.9042 |
| Previous Weekly Low | 0.8902 |
| Previous Monthly High | 0.9225 |
| Previous Monthly Low | 0.8795 |
| Daily Fibonacci 38.2% | 0.8951 |
| Daily Fibonacci 61.8% | 0.8939 |
| Daily Pivot Point S1 | 0.8936 |
| Daily Pivot Point S2 | 0.8904 |
| Daily Pivot Point S3 | 0.8888 |
| Daily Pivot Point R1 | 0.8985 |
| Daily Pivot Point R2 | 0.9001 |
| Daily Pivot Point R3 | 0.9033 |
[/s2If]
Download Nehcap EAWe have two EAs that are operational on our LIVE accounts.
- EA-FIX: Check out the details here. Download EA-FIX . EA-FIX is a non-grid HFT scalper.
- EA-GROWTH: High quality low dd EA using trend grids. Download EA_GROWTHJoin Our Telegram Group
")


