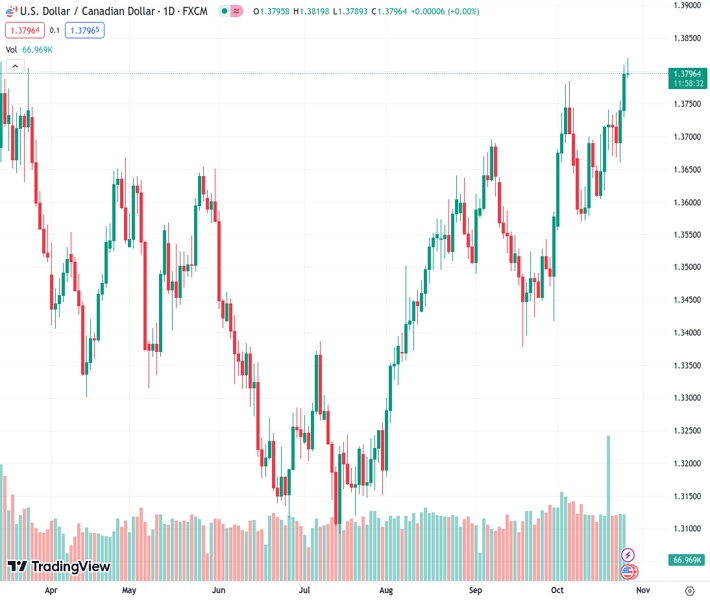
#USDCAD @ 1.37959 pulls back a bit after rising to a seven-month high earlier this Thursday.
…
This is a premium post.
[s2If !current_user_can(access_s2member_level4)]Please register for FREE REGISTER to read full post below containing analysis. In case of any error or you think you are not able to read the full post below, please email us at support#nehcap.com [lwa][/s2If] [s2If current_user_can(access_s2member_level1)]
- USD/CAD pulls back a bit after rising to a seven-month high earlier this Thursday.
The pair currently trades last at 1.37959.
The previous day high was 1.381 while the previous day low was 1.3731. The daily 38.2% Fib levels comes at 1.378, expected to provide support. Similarly, the daily 61.8% fib level is at 1.3761, expected to provide support.
The USD/CAD pair retreats a few pips from its highest level since March touched during the early part of the European session and currently trades just below the 1.3800 mark, unchanged for the day.
The intraday pullback could be attributed to some profit-taking, especially after a strong rally of over 150 pips from the weekly low, around the 1.3660 region touched on Tuesday and ahead of important US economic data. The downside, however, remains cushioned in the wake of the underlying bullish sentiment surrounding the US Dollar (USD) and a modest downtick in Crude Oil prices, which tends to undermine the commodity-linked Loonie.
Growing acceptance that the Federal Reserve (Fed) will stick to its hawkish stance and keep interest rates higher for longer remains supportive of elevated US Treasury bond yields. In fact, the yield on the benchmark 10-year US government bond climbs back closer to a 16-year peak, around the 5% threshold breached earlier this week. Apart from this, the risk-off mood benefits the safe-haven buck, which, in turn, is lending support to the USD/CAD pair.
Against the backdrop of concerns that the raging Israel-Hamas war could spill over to the wider Middle East region, worries about economic headwinds stemming from rapidly rising borrowing costs temper investors’ appetite for riskier assets. The looming recession risk, meanwhile, raises doubts over a strong global fuel demand and weighs on Crude Oil prices. This, along with the Bank of Canada’s (BoC) relatively dovish outlook, undermines the Canadian Dollar.
The Canadian central bank held its benchmark interest rates unchanged at a 22-year high of 5.0% for the second straight month in light of a slowing economy and lowered its 2023 growth estimate to 1.2% from 1.8% in July. The BoC, meanwhile, sees inflation staying above the 2% target and averaging around 3.5% through mid-2024. This left the door open for more rate hikes, which, in turn, is seen holding back bulls from placing fresh bets around the USD/CAD pair.
Investors also prefer to wait on the sidelines ahead of Thursday’s key US macro releases – the Advance Q3 GDP print. This will be accompanied by Durable Goods Orders and the usual Weekly Initial Jobless Claims, followed by Pending Home Sales data. This, along with Fed Governor Christopher Waller’s scheduled speech, will influence the USD demand. Apart from this, Oil price dynamics should provide short-term trading impetus to the USD/CAD pair.
Technical Levels: Supports and Resistances
USDCAD currently trading at 1.3796 at the time of writing. Pair opened at 1.3796 and is trading with a change of -0.0 % .
| Overview | Overview.1 | |
|---|---|---|
| 0 | Today last price | 1.3796 |
| 1 | Today Daily Change | 0.0000 |
| 2 | Today Daily Change % | -0.0000 |
| 3 | Today daily open | 1.3796 |
The pair remains strongly bullish on the daily timeframe. It trades above its 20 SMA @ 1.3666, 50 SMA 1.3595, 100 SMA @ 1.3434 and 200 SMA @ 1.3476.
| Trends | Trends.1 | |
|---|---|---|
| 0 | Daily SMA20 | 1.3666 |
| 1 | Daily SMA50 | 1.3595 |
| 2 | Daily SMA100 | 1.3434 |
| 3 | Daily SMA200 | 1.3476 |
The previous day high was 1.381 while the previous day low was 1.3731. The daily 38.2% Fib levels comes at 1.378, expected to provide support. Similarly, the daily 61.8% fib level is at 1.3761, expected to provide support.
Note the levels of interest below:
- Pivot support is noted at 1.3748, 1.3699, 1.3668
- Pivot resistance is noted at 1.3827, 1.3859, 1.3907
| Levels | Levels.1 |
|---|---|
| Previous Daily High | 1.3810 |
| Previous Daily Low | 1.3731 |
| Previous Weekly High | 1.3741 |
| Previous Weekly Low | 1.3606 |
| Previous Monthly High | 1.3694 |
| Previous Monthly Low | 1.3379 |
| Daily Fibonacci 38.2% | 1.3780 |
| Daily Fibonacci 61.8% | 1.3761 |
| Daily Pivot Point S1 | 1.3748 |
| Daily Pivot Point S2 | 1.3699 |
| Daily Pivot Point S3 | 1.3668 |
| Daily Pivot Point R1 | 1.3827 |
| Daily Pivot Point R2 | 1.3859 |
| Daily Pivot Point R3 | 1.3907 |
[/s2If]
Download Nehcap EAWe have two EAs that are operational on our LIVE accounts.
- EA-FIX: Check out the details here. Download EA-FIX . EA-FIX is a non-grid HFT scalper.
- EA-GROWTH: High quality low dd EA using trend grids. Download EA_GROWTHJoin Our Telegram Group
")


