#NZDUSD @ 0.58190 The caught some much-needed lift on Thursday after setting a new eleven-month low.
…
This is a premium post.
[s2If !current_user_can(access_s2member_level4)]Please register for FREE REGISTER to read full post below containing analysis. In case of any error or you think you are not able to read the full post below, please email us at support#nehcap.com [lwa][/s2If] [s2If current_user_can(access_s2member_level1)]
- The NZD/USD caught some much-needed lift on Thursday after setting a new eleven-month low.
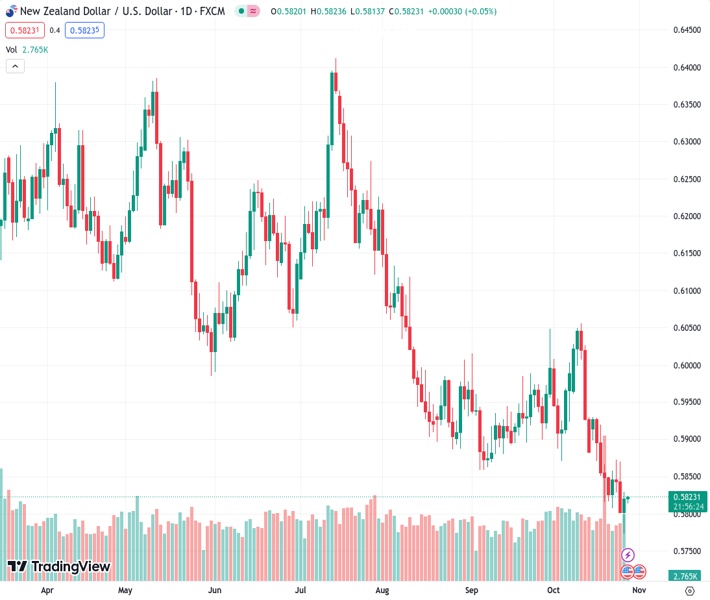
The pair currently trades last at 0.58190.
The previous day high was 0.5872 while the previous day low was 0.58. The daily 38.2% Fib levels comes at 0.5828, expected to provide resistance. Similarly, the daily 61.8% fib level is at 0.5844, expected to provide resistance.
The NZD/USD set a fresh low of 0.5772 for 2023, the pair’s lowest bid since November of last year. After chalking in a new yearly low, the Kiwi (NZD) caught a much-needed rebound and heads into the Friday Asia market session trading near 0.5820.
US Gross Domestic Product (GDP) figures broadly beat market estimates, printing at 4.9% for the 3rd quarter compared to the previous reading of 2.1%, soundly thumping the market estimates of 4.2%.
Forex Today: Dollar stays cool despite hot US economy
Despite the bumper US data read, the US Dollar (USD) gave up some ground against the NZD after etching in a new high against the Antipodean.
New Zealand Consumer Confidence for October increased slightly, helping to give some minor intraday lift to the Kiwi, with the Roy Morgan sentiment measure coming in at 88.1 compared to September’s 86.4.
The broader market now turns towards Friday’s US Personal Consumption Expenditure (PCE) Price Index reading for September. The PCE Index, as the Federal Reserve’s favored measure of inflation, will be closely watched by traders hoping for signs that the Fed will be pushed into a rate-cut cycle sooner rather than later.
With the NZD/USD trading into eleven-month lows, the way below is primed for the Kiwi to face off against swing lows from back in November of 2022, near 0.5740.
Technical resistance is mounting on the NZD/USD with the 50-day Simple Moving Average (SMA) dropping into 0.5925 and the last significant swing high sitting near 0.6050.
On the bullish side, the Relative Strength Index (RSI) is testing close to the oversold barrier, indicating there could be buying opportunities from extreme lows, though indicator traders may want to wait for a fast-line bullish crossover on the Moving Average Convergence-Divergence (MCAD) oscillator.
Technical Levels: Supports and Resistances
NZDUSD currently trading at 0.5822 at the time of writing. Pair opened at 0.5802 and is trading with a change of 0.34 % .
| Overview | Overview.1 | |
|---|---|---|
| 0 | Today last price | 0.5822 |
| 1 | Today Daily Change | 0.0020 |
| 2 | Today Daily Change % | 0.3400 |
| 3 | Today daily open | 0.5802 |
The pair remains strongly bearish on the daily time frame. It trades below the 20 SMA @ 0.5921, 50 SMA 0.5924, 100 SMA @ 0.6041 and 200 SMA @ 0.6141.
| Trends | Trends.1 | |
|---|---|---|
| 0 | Daily SMA20 | 0.5921 |
| 1 | Daily SMA50 | 0.5924 |
| 2 | Daily SMA100 | 0.6041 |
| 3 | Daily SMA200 | 0.6141 |
The previous day high was 0.5872 while the previous day low was 0.58. The daily 38.2% Fib levels comes at 0.5828, expected to provide resistance. Similarly, the daily 61.8% fib level is at 0.5844, expected to provide resistance.
Note the levels of interest below:
- Pivot support is noted at 0.5777, 0.5753, 0.5705
- Pivot resistance is noted at 0.5849, 0.5897, 0.5921
| Levels | Levels.1 |
|---|---|
| Previous Daily High | 0.5872 |
| Previous Daily Low | 0.5800 |
| Previous Weekly High | 0.5931 |
| Previous Weekly Low | 0.5815 |
| Previous Monthly High | 0.6050 |
| Previous Monthly Low | 0.5847 |
| Daily Fibonacci 38.2% | 0.5828 |
| Daily Fibonacci 61.8% | 0.5844 |
| Daily Pivot Point S1 | 0.5777 |
| Daily Pivot Point S2 | 0.5753 |
| Daily Pivot Point S3 | 0.5705 |
| Daily Pivot Point R1 | 0.5849 |
| Daily Pivot Point R2 | 0.5897 |
| Daily Pivot Point R3 | 0.5921 |
[/s2If]
Download Nehcap EAWe have two EAs that are operational on our LIVE accounts.
- EA-FIX: Check out the details here. Download EA-FIX . EA-FIX is a non-grid HFT scalper.
- EA-GROWTH: High quality low dd EA using trend grids. Download EA_GROWTHJoin Our Telegram Group
")


