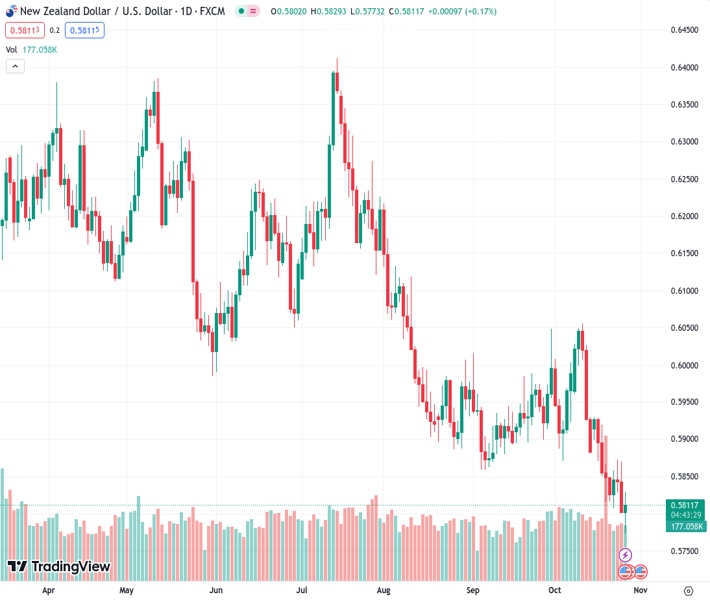
#NZDUSD @ 0.58114 rebounds from 0.5773 to 0.5807, despite lack of significant economic data from New Zealand.
…
This is a premium post.
[s2If !current_user_can(access_s2member_level4)]Please register for FREE REGISTER to read full post below containing analysis. In case of any error or you think you are not able to read the full post below, please email us at support#nehcap.com [lwa][/s2If] [s2If current_user_can(access_s2member_level1)]
- NZD/USD rebounds from 0.5773 to 0.5807, despite lack of significant economic data from New Zealand.
The pair currently trades last at 0.58114.
The previous day high was 0.5872 while the previous day low was 0.58. The daily 38.2% Fib levels comes at 0.5828, expected to provide resistance. Similarly, the daily 61.8% fib level is at 0.5844, expected to provide resistance.
NZD/USD bounces off new year-to-date (YTD) lows reached at 0.5773 after US economic growth exceeded estimates, which could warrant additional tightening by the US Federal Reserve (Fed). Nevertheless, the pair made a U-turn and trades at 0.5807, gaining a decent 0.10%.
The US Commerce Department revealed that the economy in the United States (US) grew 4.9% in the above estimates of 4.3%, in the advance estimate. Additional data showed that Durable Goods Orders for September soared 4.7%, crushing the 1.7% consensus, and along with GDP’s data, could justify the Fed’s need for another rate hike.
Regarding US labor market data, the US Bureau of Labor Statistics (BLS) released the Initial Jobless Claims for the week ending October 21, which rose by 210K, above forecasts and last week{‘s 208K and 200K, respectively, portraying the jobs market is loosening.
On the New Zealand front, the lack of economic data left NZD/USD traders adrift to market sentiment and US Dollar dynamics. On the geopolitical sphere, words from Israeli Prime Minister Benjamin Netanyahu, suggesting they are preparing for a ground offensive, sent oil prices higher, along with safe-haven peers, like the Greenback.
Ahead of the week, the New Zealand economic agenda will feature the ANZ Roy organ Consumer Confidence. On the US front, the Fed’s preferred gauge for inflation, the Core Personal Consumption Expenditures (PCE) would be released, along with the Consumer Sentiment, reported by the University of Michigan.
The NZD/USD has reclaimed the 0.5800 figure, after hitting a new year-to-date (YTD) low at 0.5773. Even though the pair has recovered some ground, the downtrend remains intact but could be at risk, if buyers reclaim the 50-day moving average (DMA) At 0.5921. For a bearish continuation, the NZD/USD sellers need to break support at 0.5800, which would expose the YTD low, which once cleared, could open the door to test last November’s low of 0.5740, ahead of 0.5700.
Technical Levels: Supports and Resistances
NZDUSD currently trading at 0.5814 at the time of writing. Pair opened at 0.5802 and is trading with a change of 0.21 % .
| Overview | Overview.1 | |
|---|---|---|
| 0 | Today last price | 0.5814 |
| 1 | Today Daily Change | 0.0012 |
| 2 | Today Daily Change % | 0.2100 |
| 3 | Today daily open | 0.5802 |
The pair remains strongly bearish on the daily time frame. It trades below the 20 SMA @ 0.5921, 50 SMA 0.5924, 100 SMA @ 0.6041 and 200 SMA @ 0.6141.
| Trends | Trends.1 | |
|---|---|---|
| 0 | Daily SMA20 | 0.5921 |
| 1 | Daily SMA50 | 0.5924 |
| 2 | Daily SMA100 | 0.6041 |
| 3 | Daily SMA200 | 0.6141 |
The previous day high was 0.5872 while the previous day low was 0.58. The daily 38.2% Fib levels comes at 0.5828, expected to provide resistance. Similarly, the daily 61.8% fib level is at 0.5844, expected to provide resistance.
Note the levels of interest below:
- Pivot support is noted at 0.5777, 0.5753, 0.5705
- Pivot resistance is noted at 0.5849, 0.5897, 0.5921
| Levels | Levels.1 |
|---|---|
| Previous Daily High | 0.5872 |
| Previous Daily Low | 0.5800 |
| Previous Weekly High | 0.5931 |
| Previous Weekly Low | 0.5815 |
| Previous Monthly High | 0.6050 |
| Previous Monthly Low | 0.5847 |
| Daily Fibonacci 38.2% | 0.5828 |
| Daily Fibonacci 61.8% | 0.5844 |
| Daily Pivot Point S1 | 0.5777 |
| Daily Pivot Point S2 | 0.5753 |
| Daily Pivot Point S3 | 0.5705 |
| Daily Pivot Point R1 | 0.5849 |
| Daily Pivot Point R2 | 0.5897 |
| Daily Pivot Point R3 | 0.5921 |
[/s2If]
Download Nehcap EAWe have two EAs that are operational on our LIVE accounts.
- EA-FIX: Check out the details here. Download EA-FIX . EA-FIX is a non-grid HFT scalper.
- EA-GROWTH: High quality low dd EA using trend grids. Download EA_GROWTHJoin Our Telegram Group
")


