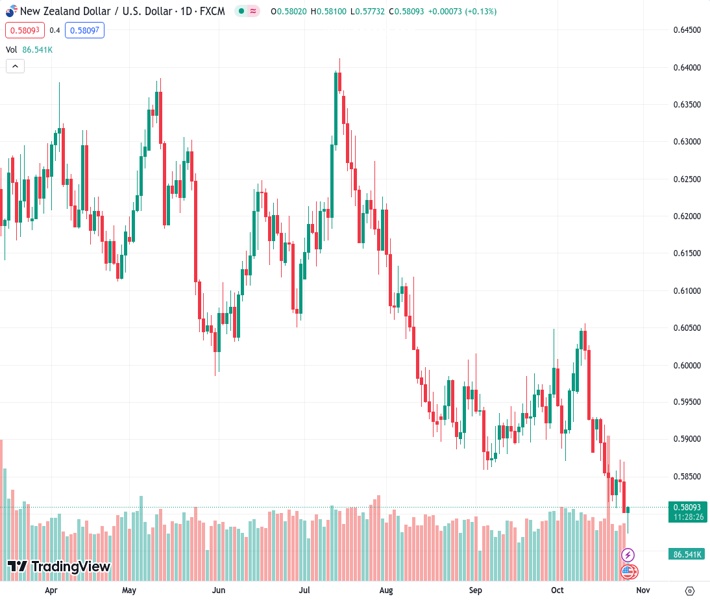
#NZDUSD @ 0.58095 pulls back from an 11-month low at 0.5773.
…
This is a premium post.
[s2If !current_user_can(access_s2member_level4)]Please register for FREE REGISTER to read full post below containing analysis. In case of any error or you think you are not able to read the full post below, please email us at support#nehcap.com [lwa][/s2If] [s2If current_user_can(access_s2member_level1)]
- NZD/USD pulls back from an 11-month low at 0.5773.
The pair currently trades last at 0.58095.
The previous day high was 0.5872 while the previous day low was 0.58. The daily 38.2% Fib levels comes at 0.5828, expected to provide resistance. Similarly, the daily 61.8% fib level is at 0.5844, expected to provide resistance.
NZD/USD dropped to an 11-month low at 0.5773 on Thursday. However, the pair has retraced the daily losses during the European session, struggling to halt a two-day losing streak.
The Moving Average Convergence Divergence (MACD) line persists below both the centerline and the signal line, setting a bearish tone for the NZD/USD pair, as echoed by market sentiment. Investors will likely watch the Kiwi’s Consumer Confidence on Friday, a key indicator for gauging sentiment and economic outlook.
The pair trades around the 0.5800 psychological level followed by the nine-day Exponential Moving Average (EMA) at 0.5849, which emerges as the key resistance lined up with the 0.5850 major level.
A firm break above the level could contribute support for the NZD/USD pair to explore the next psychological region around 0.5900 level following the 23.6% Fibonacci retracement at 0.5920.
On the downside, the region around the intraday low could act again as the immediate support followed by November’s low at 0.5740.
Furthermore, the NZD/USD duo reveals a subdued momentum, with the 14-day Relative Strength Index (RSI) showcasing a clear inclination towards weakness, dipping below the 50 level.
Technical Levels: Supports and Resistances
NZDUSD currently trading at 0.5804 at the time of writing. Pair opened at 0.5802 and is trading with a change of 0.03 % .
| Overview | Overview.1 | |
|---|---|---|
| 0 | Today last price | 0.5804 |
| 1 | Today Daily Change | 0.0002 |
| 2 | Today Daily Change % | 0.0300 |
| 3 | Today daily open | 0.5802 |
The pair remains strongly bearish on the daily time frame. It trades below the 20 SMA @ 0.5921, 50 SMA 0.5924, 100 SMA @ 0.6041 and 200 SMA @ 0.6141.
| Trends | Trends.1 | |
|---|---|---|
| 0 | Daily SMA20 | 0.5921 |
| 1 | Daily SMA50 | 0.5924 |
| 2 | Daily SMA100 | 0.6041 |
| 3 | Daily SMA200 | 0.6141 |
The previous day high was 0.5872 while the previous day low was 0.58. The daily 38.2% Fib levels comes at 0.5828, expected to provide resistance. Similarly, the daily 61.8% fib level is at 0.5844, expected to provide resistance.
Note the levels of interest below:
- Pivot support is noted at 0.5777, 0.5753, 0.5705
- Pivot resistance is noted at 0.5849, 0.5897, 0.5921
| Levels | Levels.1 |
|---|---|
| Previous Daily High | 0.5872 |
| Previous Daily Low | 0.5800 |
| Previous Weekly High | 0.5931 |
| Previous Weekly Low | 0.5815 |
| Previous Monthly High | 0.6050 |
| Previous Monthly Low | 0.5847 |
| Daily Fibonacci 38.2% | 0.5828 |
| Daily Fibonacci 61.8% | 0.5844 |
| Daily Pivot Point S1 | 0.5777 |
| Daily Pivot Point S2 | 0.5753 |
| Daily Pivot Point S3 | 0.5705 |
| Daily Pivot Point R1 | 0.5849 |
| Daily Pivot Point R2 | 0.5897 |
| Daily Pivot Point R3 | 0.5921 |
[/s2If]
Download Nehcap EAWe have two EAs that are operational on our LIVE accounts.
- EA-FIX: Check out the details here. Download EA-FIX . EA-FIX is a non-grid HFT scalper.
- EA-GROWTH: High quality low dd EA using trend grids. Download EA_GROWTHJoin Our Telegram Group
")


