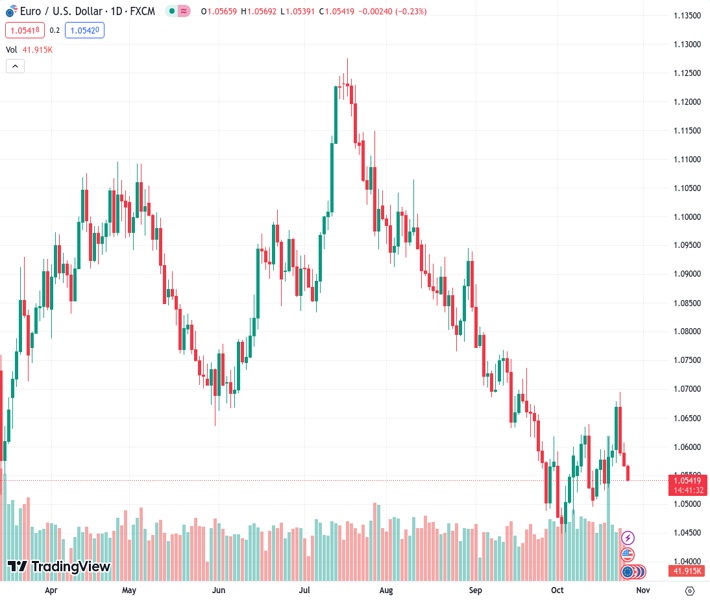
#EURUSD @ 1.05804 trades in negative territory for three straight days on Thursday.
…
This is a premium post.
[s2If !current_user_can(access_s2member_level4)]Please register for FREE REGISTER to read full post below containing analysis. In case of any error or you think you are not able to read the full post below, please email us at support#nehcap.com [lwa][/s2If] [s2If current_user_can(access_s2member_level1)]
- EUR/USD trades in negative territory for three straight days on Thursday.
The pair currently trades last at 1.05804.
The previous day high was 1.0607 while the previous day low was 1.0566. The daily 38.2% Fib levels comes at 1.0581, expected to provide resistance. Similarly, the daily 61.8% fib level is at 1.0591, expected to provide resistance.
The EUR/USD pair loses traction near 1.0545 during the early European session on Thursday. The major pair faces some sell-off on the firmer US Dollar (USD) and the downbeat Eurozone economic data. Furthermore, recent tensions in the Middle East have also prompted worries about the region’s dwindling growth prospects. Market players await the European Central Bank (ECB) interest rate decision on Thursday, which is expected to hold the rate unchanged at its October meeting.
Technically, the EUR/USD pair’s downward bias remains intact as the major pair holds below the key 100-hour Exponential Moving Average (EMA) on the four-hour chart. Additionally, the Relative Strength Index (RSI) is located in bearish territory under 50, suggesting the path of least resistance is to the downside.
The immediate upside barrier to watch is near the 100-EMA at 1.0582. The key resistance level is seen at the 1.0600-1.0606 region, representing a high of October 25 and a psychological round mark. A decisive break above the latter will see a rally to the upper boundary of Bollinger Band at 1.0685, en route to a high of September 20 at 1.0735.
On the flip side, the initial support level for EUR/USD is located at 1.0522. The mentioned level is the confluence of a lower limit of the Bollinger Band and a low of October 18. Further south, a round figure at 1.0500 will be the next downside stop. A breach of the latter will see a drop to 1.0450 (a low of October 4).
Technical Levels: Supports and Resistances
EURUSD currently trading at 1.0543 at the time of writing. Pair opened at 1.0567 and is trading with a change of -0.23 % .
| Overview | Overview.1 | |
|---|---|---|
| 0 | Today last price | 1.0543 |
| 1 | Today Daily Change | -0.0024 |
| 2 | Today Daily Change % | -0.2300 |
| 3 | Today daily open | 1.0567 |
The pair remains strongly bearish on the daily time frame. It trades below the 20 SMA @ 1.0561, 50 SMA 1.0672, 100 SMA @ 1.0823 and 200 SMA @ 1.0816.
| Trends | Trends.1 | |
|---|---|---|
| 0 | Daily SMA20 | 1.0561 |
| 1 | Daily SMA50 | 1.0672 |
| 2 | Daily SMA100 | 1.0823 |
| 3 | Daily SMA200 | 1.0816 |
The previous day high was 1.0607 while the previous day low was 1.0566. The daily 38.2% Fib levels comes at 1.0581, expected to provide resistance. Similarly, the daily 61.8% fib level is at 1.0591, expected to provide resistance.
Note the levels of interest below:
- Pivot support is noted at 1.0553, 1.0539, 1.0512
- Pivot resistance is noted at 1.0594, 1.0621, 1.0635
| Levels | Levels.1 |
|---|---|
| Previous Daily High | 1.0607 |
| Previous Daily Low | 1.0566 |
| Previous Weekly High | 1.0617 |
| Previous Weekly Low | 1.0511 |
| Previous Monthly High | 1.0882 |
| Previous Monthly Low | 1.0488 |
| Daily Fibonacci 38.2% | 1.0581 |
| Daily Fibonacci 61.8% | 1.0591 |
| Daily Pivot Point S1 | 1.0553 |
| Daily Pivot Point S2 | 1.0539 |
| Daily Pivot Point S3 | 1.0512 |
| Daily Pivot Point R1 | 1.0594 |
| Daily Pivot Point R2 | 1.0621 |
| Daily Pivot Point R3 | 1.0635 |
[/s2If]
Download Nehcap EAWe have two EAs that are operational on our LIVE accounts.
- EA-FIX: Check out the details here. Download EA-FIX . EA-FIX is a non-grid HFT scalper.
- EA-GROWTH: High quality low dd EA using trend grids. Download EA_GROWTHJoin Our Telegram Group
")


